signal strength 4 of 5

The Double Top pattern has been formed on NZDCAD H1. It signals that the trend has been changed from upwards to downwards. Probably, if the base of the pattern 0.8276 is broken, the downward movement will continue.
Xem thêm
- All
- Double Top
- Flag
- Head and Shoulders
- Pennant
- Rectangle
- Triangle
- Triple top
- All
- #AAPL
- #AMZN
- #Bitcoin
- #EBAY
- #FB
- #GOOG
- #INTC
- #KO
- #MA
- #MCD
- #MSFT
- #NTDOY
- #PEP
- #TSLA
- #TWTR
- AUDCAD
- AUDCHF
- AUDJPY
- AUDUSD
- EURCAD
- EURCHF
- EURGBP
- EURJPY
- EURNZD
- EURRUB
- EURUSD
- GBPAUD
- GBPCHF
- GBPJPY
- GBPUSD
- GOLD
- NZDCAD
- NZDCHF
- NZDJPY
- NZDUSD
- SILVER
- USDCAD
- USDCHF
- USDJPY
- USDRUB
- All
- M5
- M15
- M30
- H1
- D1
- All
- Buy
- Sale
- All
- 1
- 2
- 3
- 4
- 5
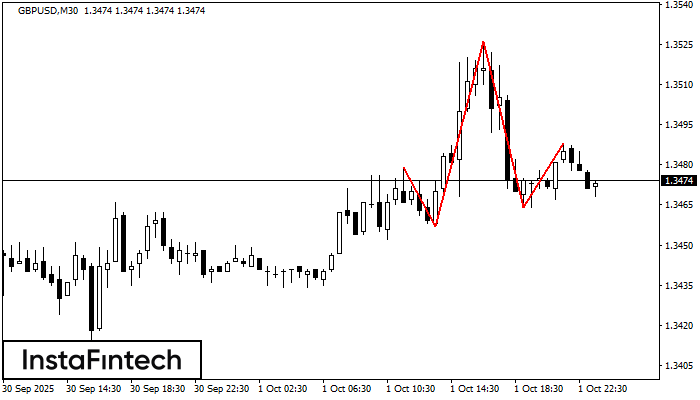
The GBPUSD M30 formed the Head and Shoulders pattern with the following features: The Head’s top is at 1.3526, the Neckline and the upward angle are at 1.3457/1.3464. The formation
Open chart in a new window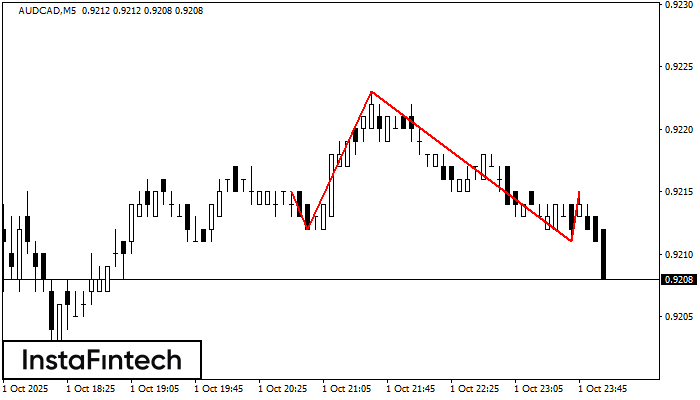
The AUDCAD M5 formed the Head and Shoulders pattern with the following features: The Head’s top is at 0.9223, the Neckline and the upward angle are at 0.9212/0.9211. The formation
The M5 and M15 time frames may have more false entry points.
Open chart in a new window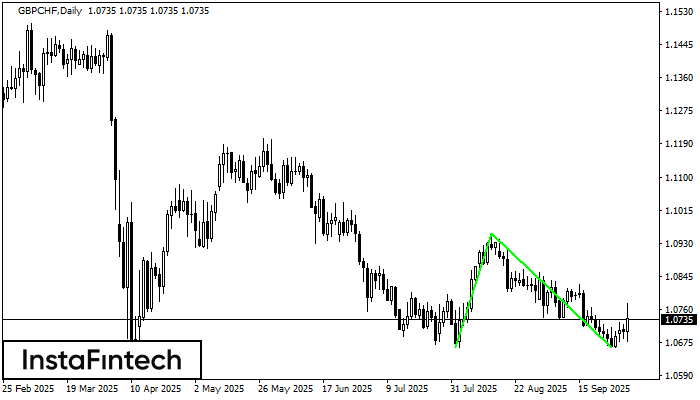
The Double Bottom pattern has been formed on GBPCHF D1. This formation signals a reversal of the trend from downwards to upwards. The signal is that a buy trade should
Open chart in a new window