signal strength 2 of 5

The Triple Top pattern has formed on the chart of the EURUSD M15. Features of the pattern: borders have an ascending angle; the lower line of the pattern has the coordinates 1.1387/1.1391 with the upper limit 1.1397/1.1397; the projection of the width is 10 points. The formation of the Triple Top figure most likely indicates a change in the trend from upward to downward. This means that in the event of a breakdown of the support level of 1.1387, the price is most likely to continue the downward movement.
The M5 and M15 time frames may have more false entry points.
Xem thêm
- All
- Double Top
- Flag
- Head and Shoulders
- Pennant
- Rectangle
- Triangle
- Triple top
- All
- #AAPL
- #AMZN
- #Bitcoin
- #EBAY
- #FB
- #GOOG
- #INTC
- #KO
- #MA
- #MCD
- #MSFT
- #NTDOY
- #PEP
- #TSLA
- #TWTR
- AUDCAD
- AUDCHF
- AUDJPY
- AUDUSD
- EURCAD
- EURCHF
- EURGBP
- EURJPY
- EURNZD
- EURRUB
- EURUSD
- GBPAUD
- GBPCHF
- GBPJPY
- GBPUSD
- GOLD
- NZDCAD
- NZDCHF
- NZDJPY
- NZDUSD
- SILVER
- USDCAD
- USDCHF
- USDJPY
- USDRUB
- All
- M5
- M15
- M30
- H1
- D1
- All
- Buy
- Sale
- All
- 1
- 2
- 3
- 4
- 5
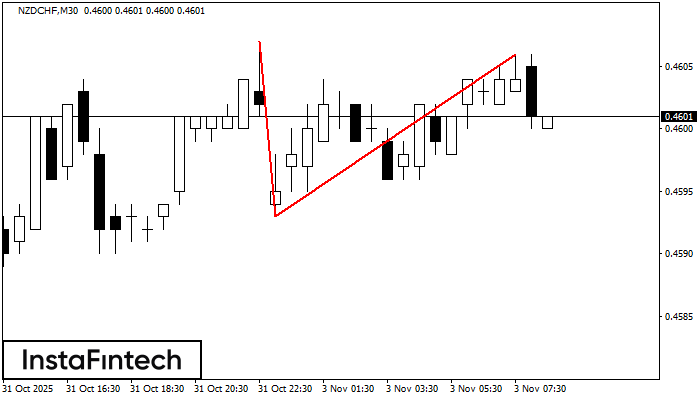
Mô hình đảo chiều Đỉnh đôi đã được hình thành trên NZDCHF M30. Đặc điểm: ranh giới trên 0.4607; ranh giới dưới 0.4593; chiều rộng của mô hình
Open chart in a new window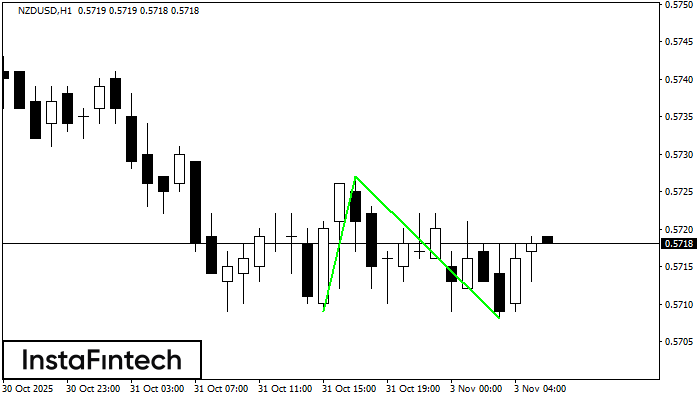
Mô hình Đáy đôi đã được hình thành trên NZDUSD H1. Sự hình thành này báo hiệu sự đảo chiều của xu hướng từ dưới lên trên. Tín hiệu
Open chart in a new window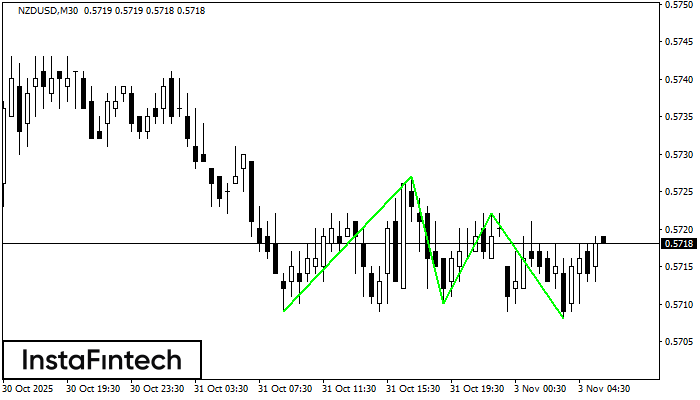
Mô hình Đáy ba đã được hình thành trên biểu đồ của NZDUSD M30. Các tính năng của mô hình: Đường dưới của mô hình có tọa độ 0.5727
Open chart in a new window