signal strength 2 of 5
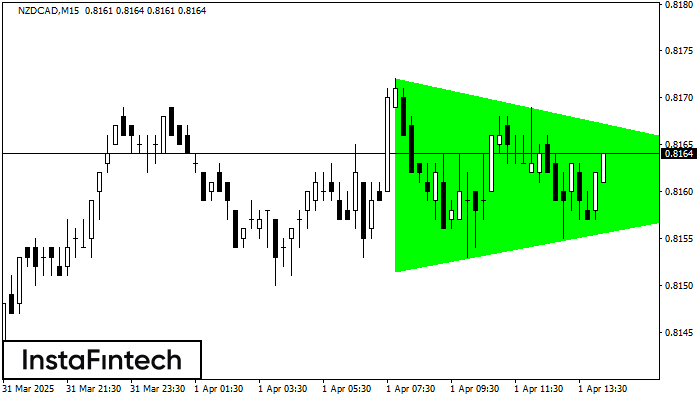
According to the chart of M15, NZDCAD formed the Bullish Symmetrical Triangle pattern. Description: This is the pattern of a trend continuation. 0.8172 and 0.8152 are the coordinates of the upper and lower borders respectively. The pattern width is measured on the chart at 20 pips. Outlook: If the upper border 0.8172 is broken, the price is likely to continue its move by 0.8184.
The M5 and M15 time frames may have more false entry points.
- All
- Double Top
- Flag
- Head and Shoulders
- Pennant
- Rectangle
- Triangle
- Triple top
- All
- #AAPL
- #AMZN
- #Bitcoin
- #EBAY
- #FB
- #GOOG
- #INTC
- #KO
- #MA
- #MCD
- #MSFT
- #NTDOY
- #PEP
- #TSLA
- #TWTR
- AUDCAD
- AUDCHF
- AUDJPY
- AUDUSD
- EURCAD
- EURCHF
- EURGBP
- EURJPY
- EURNZD
- EURRUB
- EURUSD
- GBPAUD
- GBPCHF
- GBPJPY
- GBPUSD
- GOLD
- NZDCAD
- NZDCHF
- NZDJPY
- NZDUSD
- SILVER
- USDCAD
- USDCHF
- USDJPY
- USDRUB
- All
- M5
- M15
- M30
- H1
- D1
- All
- Buy
- Sale
- All
- 1
- 2
- 3
- 4
- 5
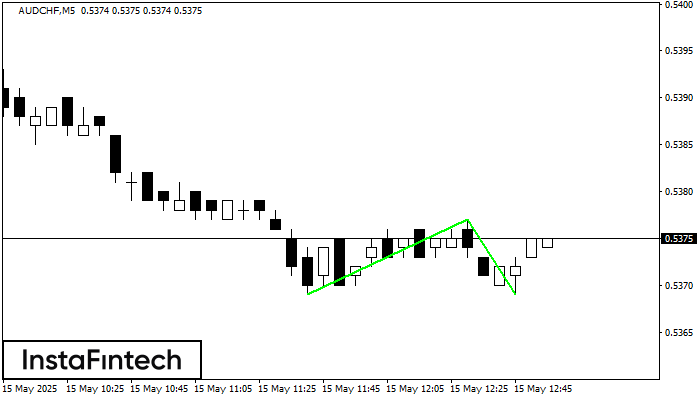
Corak Double Bottom telah dibentuk pada AUDCHF M5; sempadan atas adalah 0.5377; sempadan bawah adalah 0.5369. Lebar corak adalah 8 mata. Sekiranya penembusan sempadan atas 0.5377, perubahan aliran boleh diramalkan
Carta masa M5 dan M15 mungkin mempunyai lebih banyak titik kemasukan palsu.
Open chart in a new window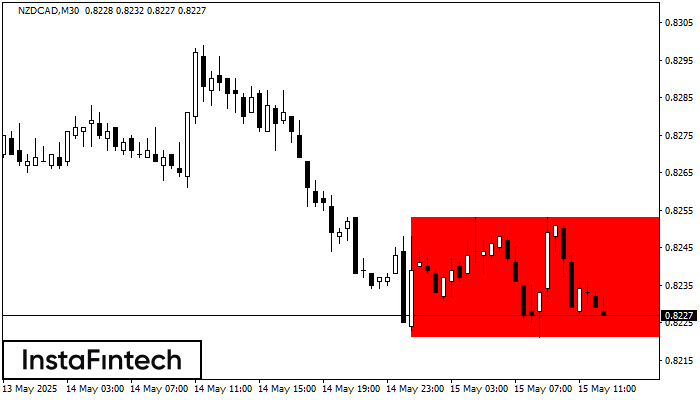
Berdasarkan carta M30, NZDCAD telah membentuk Segi Empat Menurun. Corak ini menunjukkan kesinambungan aliran. Sempadan atas adalah 0.8253, sempadan bawah adalah 0.8221. Isyarat bermakna bahawa kedudukan pendek perlu dibuka selepas
Open chart in a new window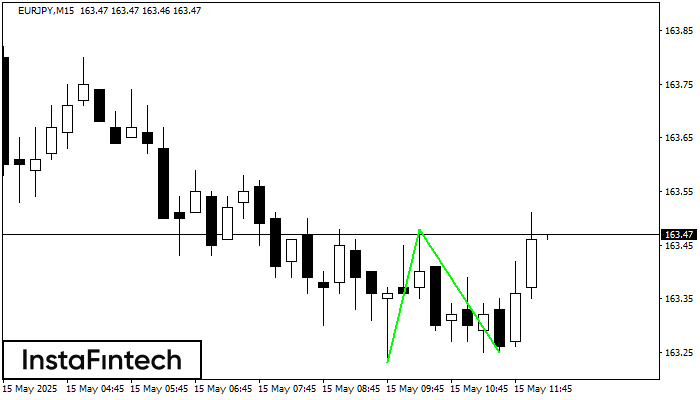
Corak Double Bottom telah dibentuk pada EURJPY M15. Pembentukan ini menandakan pembalikan aliran dari aliran menurun ke atas. Isyarat ialah perdagangan membeli harus dibuka selepas sempadan atas corak 163.48 telah
Carta masa M5 dan M15 mungkin mempunyai lebih banyak titik kemasukan palsu.
Open chart in a new window