empty
01.03.2024 09:32 AM
Technical Analysis of EUR/USD for March 1, 2024

EUR/USD Outlook Amidst Global Economic Dynamics: A Fundamental and Technical Perspective

Key Takeaways:

  1. The EUR/USD pair is experiencing mixed signals with technical indicators suggesting a balanced buying and selling sentiment.
  2. Global stock market gains and a bullish sentiment on the scoreboard indicate a favorable view among investors.
  3. Critical economic indicators point to a nuanced economic landscape with varying PMI data and regional economic policies.

This image is no longer relevant

Fundamental Analysis:

Global markets have recently witnessed a positive uptrend with Wall Street indices closing higher — the S&P 500 up by 0.52%, Dow Jones by 0.12%, NASDAQ by 0.90%, and the Russell 2000 by 0.71%. The ripple effect continued in the Asia-Pacific markets, with significant gains noted in S&P/ASX 200 up by 0.6%, Nifty 50 by 1.3%, and Chinese indices up to 0.9%. The Japanese Nikkei rose by an impressive 1.9%, testing the 40,000-point level for the first time in history.

Futures for European indices point to a higher opening, with the DAX index futures trading above 17,800 points for the first time. This optimistic outset in Europe is amidst various economic announcements:

  • The Bank of Japan's Governor Ueda stated that Japan's economy is not in a situation suggesting sustained achievement of its inflation target.
  • RBNZ's Governor Orr expressed that New Zealand's economy is progressing as expected, but inflation remains too high, although it is decreasing alongside inflation expectations.
  • Deputy Governor Hawkesby of RBNZ indicated that New Zealand's monetary policy would remain restrictive to anchor inflation expectations around 2%.

Chinese manufacturing PMI dipped slightly in February, marking the fifth consecutive month below the 50-point threshold, while the services sector saw an increase. Australia and Japan reported a decline in their manufacturing PMI, indicating contraction. In contrast, cryptocurrency markets are seeing gains, and commodities, especially energy and precious metals, are trending upwards. The AUD and NZD emerge as the strongest among major currencies, while the JPY and CHF are lagging.

This image is no longer relevant

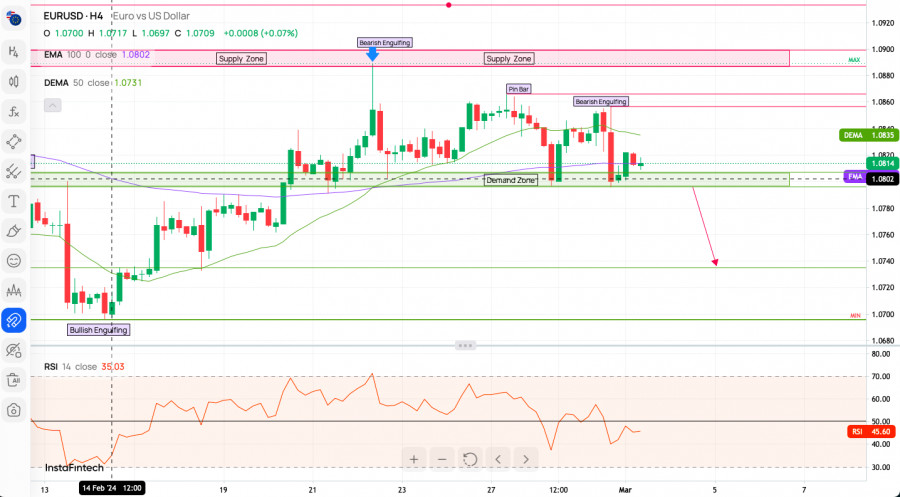
Technical Analysis for EUR/USD as of March 1, 2024:

The EUR/USD pair shows a complex technical picture as indicated in yesterday's analysis (please take a look at the scenarios), so today we got this update:

  • Technical Indicators: Out of 22, 9 indicate a 'Buy', 8 a 'Sell', and 6 remain Neutral, presenting a relatively balanced outlook.
  • Moving Averages: Contrasting the above, 17 out of 18 moving averages signal a 'Sell', showing a potential downtrend on the horizon.
  • Sentiment Scoreboard: The overall sentiment is bullish, with a 60% bullish vs. 40% bearish stance. The past week has maintained this bullish sentiment, while the last three days have edged towards neutral.

Market Scenarios:

  • Bullish Scenario: The prevailing bullish sentiment and positive global market trends could support the EUR against the USD. If the bullish momentum persists, we might see a breakthrough resistance levels.
  • Bearish Scenario: The dominant 'Sell' signals from moving averages suggest that the EUR/USD might face downward pressure. A shift in sentiment or adverse economic data could exacerbate this trend.

In conclusion, the EUR/USD pair presents a challenging environment for traders, with fundamental indicators pointing towards a generally positive economic sentiment, while technical analysis signals a more cautious approach.

Useful Links
Important Notice

The begginers in forex trading need to be very careful when making decisions about entering the market. Before the release of important reports, it is best to stay out of the market to avoid being caught in sharp market fluctuations due to increased volatility. If you decide to trade during the news release, then always place stop orders to minimize losses.

Without placing stop orders, you can very quickly lose your entire deposit, especially if you do not use money management and trade large volumes. For successful trading, you need to have a clear trading plan and stay focues and disciplined. Spontaneous trading decision based on the current market situation is an inherently losing strategy for a scalper or daytrader.

#instaforex #analysis #sebastianseliga

Sebastian Seliga,
Especialista em análise na InstaForex
© 2007-2025
Selecionar intervalo de tempo
5
min
15
min
30
min
1
hora
4
horas
1
dia
1
s.
Ganhe com as variações das taxas das criptomoedas com a InstaForex.
Baixe o MetaTrader 4 e abra a sua primeira operação.
  • Grand Choice
    Contest by
    InstaForex
    InstaForex always strives to help you
    fulfill your biggest dreams.
    PARTICIPE DO CONCURSO

Recommended Stories

Sinais de negociação para o EUR/USD para 24-26 de abril de 2025: venda abaixo de 1,1435 (SMA 214 - 7/8 de Murray)

Nosso plano de negociação para as próximas horas é aguardar que o euro se recupere até os níveis de resistência próximos de 1,1429 ou 1,1435 para vender, com alvos

Dimitrios Zappas 21:44 2025-04-24 UTC+2

Análise técnica do movimento de preço da prata, quinta-feira, 24 de abril de 2025

No gráfico de 4 horas, o instrumento da commodity prata apresenta sinais de fortalecimento. Esse cenário é confirmado pelo movimento do preço, que está acima da WMA (30, deslocamento 2)

Arief Makmur 17:28 2025-04-24 UTC+2

Análise técnica do movimento de preços do índice Nasdaq 100, quinta-feira, 24 de abril de 2025.

Embora o índice Nasdaq 100 esteja se movimentando lateralmente no gráfico de 4 horas, a faixa de oscilação é relativamente ampla, o que ainda representa uma oportunidade promissora. Atualmente

Arief Makmur 17:25 2025-04-24 UTC+2

OURO: Os preços do ouro podem cair significativamente em um futuro próximo

Os preços do ouro passaram recentemente por uma correção significativa, refletindo as expectativas de que Estados Unidos e China iniciem negociações concretas sobre tarifas e comércio em geral. A declaração

Pati Gani 17:16 2025-04-24 UTC+2

Análise técnica do movimento intradiário de preços do AUD/JPY, quarta-feira, 23 de abril de 2025

Com a presença de uma divergência entre o movimento de preços do par AUD/JPY e o indicador Stochastic Oscillator, além do preço estar acima da média móvel ponderada (WMA)

Arief Makmur 16:00 2025-04-23 UTC+2

Análise técnica do movimento intradiário do preço do ouro, quarta-feira, 23 de abril de 2025

Ao observar o gráfico de 4 horas, o ouro ainda apresenta viés de alta. No entanto, a divergência entre o movimento de preços do ouro e o indicador Stochastic Oscillator

Arief Makmur 15:51 2025-04-23 UTC+2

Análise técnica do movimento intradiário de preços do GBP/CHF, terça-feira, 22 de abril de 2025

Ao analisarmos o gráfico de 4 horas do par cruzado GBP/CHF, observamos diversos elementos interessantes. Primeiramente, o surgimento de um padrão de triângulo, aliado ao movimento

Arief Makmur 15:50 2025-04-22 UTC+2

Análise técnica do movimento intradiário de preços do AUD/CAD, terça-feira, 22 de abril de 2025

Com o par AUD/CAD se movendo acima da média móvel ponderada de 21 períodos (WMA 21), que apresenta inclinação positiva, e com a ocorrência de convergência entre o movimento

Arief Makmur 15:47 2025-04-22 UTC+2

Análise técnica do movimento intradiário de preços do EUR/GBP, segunda-feira, 21 de abril de 2025

Com base no gráfico de 4 horas, o par EUR/GBP parece estar se movendo acima da EMA (100), o que indica que os compradores dominam o par. Assim, no futuro

Arief Makmur 15:36 2025-04-21 UTC+2

Análise técnica do movimento intradiário do USD/JPY, segunda-feira, 21 de abril de 2025.

Com o surgimento da convergência entre o movimento de preço do principal par de moedas USD/JPY, o indicador Oscilador Estocástico e a posição da EMA (100), que está acima

Arief Makmur 15:31 2025-04-21 UTC+2
Não pode falar agora?
Faça sua pergunta no chat.
Widget callback
 

Dear visitor,

Your IP address shows that you are currently located in the USA. If you are a resident of the United States, you are prohibited from using the services of InstaFintech Group including online trading, online transfers, deposit/withdrawal of funds, etc.

If you think you are seeing this message by mistake and your location is not the US, kindly proceed to the website. Otherwise, you must leave the website in order to comply with government restrictions.

Why does your IP address show your location as the USA?

  • - you are using a VPN provided by a hosting company based in the United States;
  • - your IP does not have proper WHOIS records;
  • - an error occurred in the WHOIS geolocation database.

Please confirm whether you are a US resident or not by clicking the relevant button below. If you choose the wrong option, being a US resident, you will not be able to open an account with InstaForex anyway.

We are sorry for any inconvenience caused by this message.