empty
25.01.2024 06:29 AM
Trading Signals for GOLD (XAU/USD) on January 25-27, 2024: sell below $2,015 (21 SMA - 5/8 Murray)

This image is no longer relevant

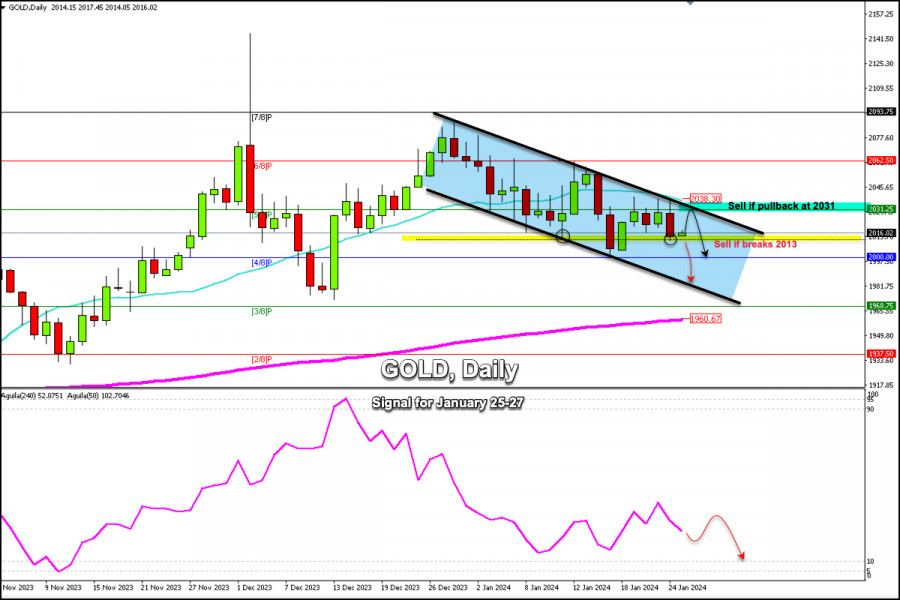
According to the daily chart, gold has been trading within a bearish trend channel since December 19. Yesterday during the American session, it tried to break this channel, reaching the top of the trend channel around 2,035. As it was not successful and the bullish force was exhausted, we saw a strong technical correction and the price reached the weekly support of 2,011.13.

We currently observe that the XAU/USD is having a technical rebound, moving away from the 2,011 low and forming a small bullish candlestick.

However, if gold consolidates above 2,015, we could see a recovery and the instrument could reach 5/8 Murray around 2,031 or around the top of the downtrend channel at 2,033.

On the other hand, if gold decisively breaks the weekly support located at 2,015 and consolidates below 2,013, we could expect a downward acceleration towards the psychological level of $2,000. The metal could even reach the bottom of the downtrend channel around 1,975.

The key for the next few days for gold will be to consolidate above 2,015 so that we can look for buying opportunities with targets at 2,031 or even at the 21 SMA at 2,038.

On the contrary, if gold falls below 2,013, it could be seen as a signal to sell in the coming days, with targets at the psychological level of $2,000 and at 3/8 Murray located at 1,968. Finally, the price could drop to the 200 EMA at 1,960.

In case gold breaks the downtrend channel and consolidates above 2,040, it could be seen as the beginning of a sustained recovery and the metal could reach 6/8 Murray at 2,062. The price could even rebound to 2,093.

The eagle indicator is giving a negative signal. Any technical bounce while trading below 2,040 will be seen as an opportunity to sell with the target at 1,960.

Dimitrios Zappas,
Especialista em análise na InstaForex
© 2007-2025
Selecionar intervalo de tempo
5
min
15
min
30
min
1
hora
4
horas
1
dia
1
s.
Ganhe com as variações das taxas das criptomoedas com a InstaForex.
Baixe o MetaTrader 4 e abra a sua primeira operação.
  • Grand Choice
    Contest by
    InstaForex
    InstaForex always strives to help you
    fulfill your biggest dreams.
    PARTICIPE DO CONCURSO

Recommended Stories

Sinais de negociação para o EUR/USD para 24-26 de abril de 2025: venda abaixo de 1,1435 (SMA 214 - 7/8 de Murray)

Nosso plano de negociação para as próximas horas é aguardar que o euro se recupere até os níveis de resistência próximos de 1,1429 ou 1,1435 para vender, com alvos

Dimitrios Zappas 21:44 2025-04-24 UTC+2

Análise técnica do movimento de preço da prata, quinta-feira, 24 de abril de 2025

No gráfico de 4 horas, o instrumento da commodity prata apresenta sinais de fortalecimento. Esse cenário é confirmado pelo movimento do preço, que está acima da WMA (30, deslocamento 2)

Arief Makmur 17:28 2025-04-24 UTC+2

Análise técnica do movimento de preços do índice Nasdaq 100, quinta-feira, 24 de abril de 2025.

Embora o índice Nasdaq 100 esteja se movimentando lateralmente no gráfico de 4 horas, a faixa de oscilação é relativamente ampla, o que ainda representa uma oportunidade promissora. Atualmente

Arief Makmur 17:25 2025-04-24 UTC+2

OURO: Os preços do ouro podem cair significativamente em um futuro próximo

Os preços do ouro passaram recentemente por uma correção significativa, refletindo as expectativas de que Estados Unidos e China iniciem negociações concretas sobre tarifas e comércio em geral. A declaração

Pati Gani 17:16 2025-04-24 UTC+2

Análise técnica do movimento intradiário de preços do AUD/JPY, quarta-feira, 23 de abril de 2025

Com a presença de uma divergência entre o movimento de preços do par AUD/JPY e o indicador Stochastic Oscillator, além do preço estar acima da média móvel ponderada (WMA)

Arief Makmur 16:00 2025-04-23 UTC+2

Análise técnica do movimento intradiário do preço do ouro, quarta-feira, 23 de abril de 2025

Ao observar o gráfico de 4 horas, o ouro ainda apresenta viés de alta. No entanto, a divergência entre o movimento de preços do ouro e o indicador Stochastic Oscillator

Arief Makmur 15:51 2025-04-23 UTC+2

Análise técnica do movimento intradiário de preços do GBP/CHF, terça-feira, 22 de abril de 2025

Ao analisarmos o gráfico de 4 horas do par cruzado GBP/CHF, observamos diversos elementos interessantes. Primeiramente, o surgimento de um padrão de triângulo, aliado ao movimento

Arief Makmur 15:50 2025-04-22 UTC+2

Análise técnica do movimento intradiário de preços do AUD/CAD, terça-feira, 22 de abril de 2025

Com o par AUD/CAD se movendo acima da média móvel ponderada de 21 períodos (WMA 21), que apresenta inclinação positiva, e com a ocorrência de convergência entre o movimento

Arief Makmur 15:47 2025-04-22 UTC+2

Análise técnica do movimento intradiário de preços do EUR/GBP, segunda-feira, 21 de abril de 2025

Com base no gráfico de 4 horas, o par EUR/GBP parece estar se movendo acima da EMA (100), o que indica que os compradores dominam o par. Assim, no futuro

Arief Makmur 15:36 2025-04-21 UTC+2

Análise técnica do movimento intradiário do USD/JPY, segunda-feira, 21 de abril de 2025.

Com o surgimento da convergência entre o movimento de preço do principal par de moedas USD/JPY, o indicador Oscilador Estocástico e a posição da EMA (100), que está acima

Arief Makmur 15:31 2025-04-21 UTC+2
Não pode falar agora?
Faça sua pergunta no chat.
Widget callback
 

Dear visitor,

Your IP address shows that you are currently located in the USA. If you are a resident of the United States, you are prohibited from using the services of InstaFintech Group including online trading, online transfers, deposit/withdrawal of funds, etc.

If you think you are seeing this message by mistake and your location is not the US, kindly proceed to the website. Otherwise, you must leave the website in order to comply with government restrictions.

Why does your IP address show your location as the USA?

  • - you are using a VPN provided by a hosting company based in the United States;
  • - your IP does not have proper WHOIS records;
  • - an error occurred in the WHOIS geolocation database.

Please confirm whether you are a US resident or not by clicking the relevant button below. If you choose the wrong option, being a US resident, you will not be able to open an account with InstaForex anyway.

We are sorry for any inconvenience caused by this message.