Forecast for February 18 :
Analytical review of currency pairs on the scale of H1:
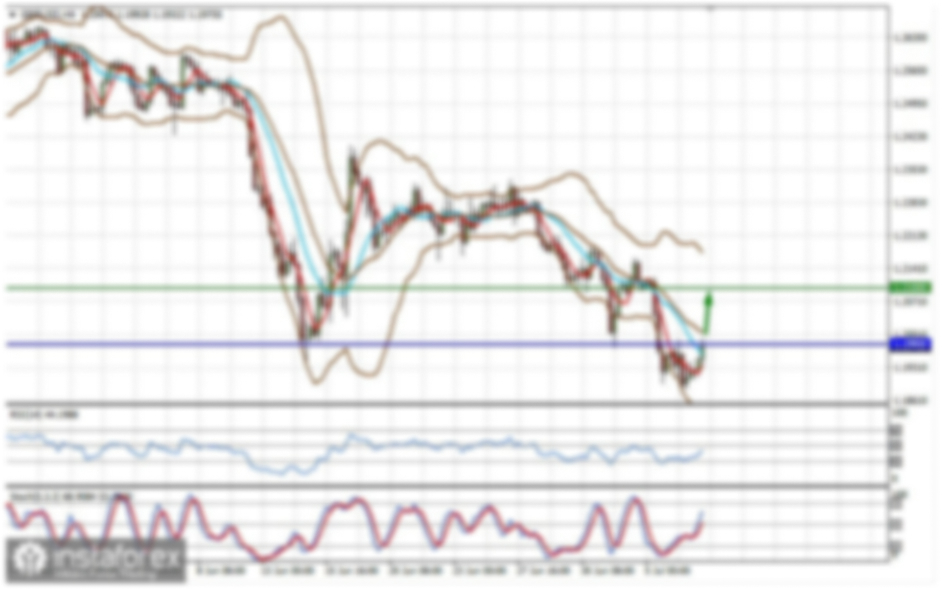
For the euro / dollar pair, the key levels on the H1 scale are: 1.0938, 1.0910, 1.0888, 1.0864 and 1.0827. Here, the price is near the limit values for the downward cycle, and therefore, we expect a correction. Short-term upward movement is expected in the range of 1.0864 - 1.0888. The breakdown of the last value will lead to the development of correction. Here, the goal is 1.0910. This level is a key support for the downward structure and its passage at the price will lead to the formation of expressed initial conditions for the upward cycle. In this case, the potential target is 1.0938.
The main trend is a downward structure from January 31, we expect a correction
Trading recommendations:
Buy: 1.0864 Take profit: 1.0887
Buy: 1.0888 Take profit: 1.0910
Sell: Take profit:
Sell: Take profit:
For the pound / dollar pair, the key levels on the H1 scale are: 1.3182, 1.3157, 1.3114, 1.3082, 1.3045, 1.2990, 1.2961 and 1.2928. Here, we are following the development of the ascending structure of February 10. The continuation of the movement to the top is expected after the breakdown of the level of 1.3045. In this case, the target is 1.3082. Short-term upward movement, as well as consolidation is in the range of 1.3082 - 1.3114. The breakdown of the level of 1.3114 will lead to a pronounced movement. In this case, the potential target is 1.3157. Upon reaching which, we expect a consolidated movement in the range 1.3157 - 1.3182, as well as a correction.
Short-term downward movement is possibly in the range of 1.2990 - 1.2961. The breakdown of the latter value will lead to an in-depth correction. Here, the target is 1.2928. This level is a key support for the upward structure.
The main trend is the ascending structure of February 10.
The main trend is the rising structure of February 10th.
Trading recommendations:
Buy: 1.3045 Take profit: 1.3080
Buy: 1.3083 Take profit: 1.3112
Sell: 1.2990 Take profit: 1.2962
Sell: 1.2959 Take profit: 1.2930
For the dollar / franc pair, the key levels on the H1 scale are: 0.9858, 0.9826, 0.9810, 0.9787, 0.9771, 0.9743 and 0.9719. Here, we are following the local ascendant structure of February 12. Short-term upward movement is expected in the range of 0.9810 - 0.9826. The breakdown of the latter value will lead to movement to a potential target - 0.9857. We expect a pullback to the bottom from this level.
Short-term downward movement is possibly in the range of 0.9787 - 0.9771. The breakdown of the latter value will lead to the development of a downward structure. In this case, the first potential target is 0.9743. We expect expressed initial conditions for a downward cycle to the level of 0.9719.
The main trend is the local potential for the top of February 12
Trading recommendations:
Buy : 0.9810 Take profit: 0.9824
Buy : 0.9827 Take profit: 0.9856
Sell: 0.9787 Take profit: 0.9773
Sell: 0.9769 Take profit: 0.9745
For the dollar / yen pair, the key levels on the scale are : 110.80, 110.47, 109.99, 109.62, 109.41 and 109.07. Here, we are following the development of the ascending structure of January 31. The continuation of the movement to the top is expected after the breakdown of the level of 110.00. In this case, the target is 110.47. Price consolidation is near this level. For the potential value for the top, we consider the level 110.80. Upon reaching which, we expect a pullback to the bottom.
Short-term downward movement is possibly in the range of 109.62 - 109.41. The breakdown of the latter value will lead to an in-depth correction. Here, the goal is 109.07. This level is a key support for the top.
Main trend: upward structure of January 31
Trading recommendations:
Buy: 110.00 Take profit: 110.45
Buy : 110.49 Take profit: 110.80
Sell: 109.60 Take profit: 109.42
Sell: 109.38 Take profit: 109.10
For the Canadian dollar / US dollar pair, the key levels on the H1 scale are: 1.3303, 1.3281, 1.3267, 1.3228, 1.3201 and 1.3165. Here, the descending structure of February 10 is considered medium-term. The continuation of movement to the bottom is expected after the breakdown of the level of 1.3228. In this case, the target is 1.3201. Price consolidation is near this level. The breakdown of the level of 1.3200 will lead to the development of pronounced movement to the bottom. Here, the potential target is 1.3165. We expect a pullback to the top from this level.
Short-term upward movement is possibly in the range of 1.3267 - 1.3281. The breakdown of the latter value will lead to an in-depth correction. Here, the target is 1.3303. This level is a key support for the downward structure.
The main trend is the formation of medium-term initial conditions for the downward movement of February 10
Trading recommendations:
Buy: 1.3267 Take profit: 1.3281
Buy : 1.3283 Take profit: 1.3303
Sell: 1.3226 Take profit: 1.3203
Sell: 1.3199 Take profit: 1.3167
For the Australian dollar / US dollar pair, the key levels on the H1 scale are : 0.6810, 0.6776, 0.6761, 0.6739, 0.6703, 0.6684 and 0.6660. Here, we are following the development of the ascending structure of February 7. The continuation of the movement to the top is expected after the breakdown of the level of 0.6740. In this case, the target is 0.6761. Short-term upward movement, as well as consolidation is in the range of 0.6761 - 0.6776. For the potential value for the top, we consider the level of 0.6810. Upon reaching which, we expect a pullback to the bottom.
Consolidated movement is possibly in the range of 0.6703 - 0.6684. Hence, the high probability of a reversal to the top. The breakdown of the level of 0.6684 will lead to the formation of a downward structure. Here, the potential target is 0.6660.
The main trend is the upward structure of February 7
Trading recommendations:
Buy: 0.6740 Take profit: 0.6761
Buy: 0.6762 Take profit: 0.6775
Sell : Take profit :
Sell: 0.6682 Take profit: 0.6660
For the euro / yen pair, the key levels on the H1 scale are: 119.85, 119.51, 119.26, 118.80, 118.36 and 118.13. Here, we are following the descending structure of February 5. The continuation of movement to the bottom is expected after the breakdown of the level of 118.80. In this case, the goal is 118.36. For the potential value for the bottom, we consider the level of 118.13. Upon reaching which, we expect consolidation, as well as a pullback to the top.
Short-term upward movement is possibly in the range of 119.26 - 119.51. The breakdown of the last value will lead to an in-depth correction. Here, the goal is 119.85. This level is a key support for the downward structure.
The main trend is the descending structure of February 5
Trading recommendations:
Buy: 119.26 Take profit: 119.50
Buy: 119.55 Take profit: 119.85
Sell: 118.80 Take profit: 118.38
Sell: 118.34 Take profit: 118.14
For the pound / yen pair, the key levels on the H1 scale are : 145.19, 144.57, 144.12, 143.50, 142.75, 142.47 and 142.08. Here, we revised the key targets for the upward structure of February 10. The continuation of movement to the top is expected after the breakdown of the level of 143.50. In this case, the target is 144.12. The breakdown of this value will lead to short-term upward movement in the range 144.12 - 144.57. Hence, there is also a high probability of a reversal to correction. For the potential value for the top, we consider the level of 145.19. Upon reaching this level, we expect a pullback to the bottom.
Short-term downward movement, as well as consolidation, are possible in the range of 142.75 - 142.47; hence, the likelihood of a reversal to the top. The breakdown of the level of 142.47 will lead to an in-depth correction. Here, the goal is 142.08. This level is a key support for the top.
The main trend is the rising structure of February 10
Trading recommendations:
Buy: 143.50 Take profit: 144.12
Buy: 144.15 Take profit: 144.50
Sell: 142.75 Take profit: 142.50
Sell: 142.44 Take profit: 142.10