Forecast for February 6:
Analytical review of currency pairs on the scale of H1:
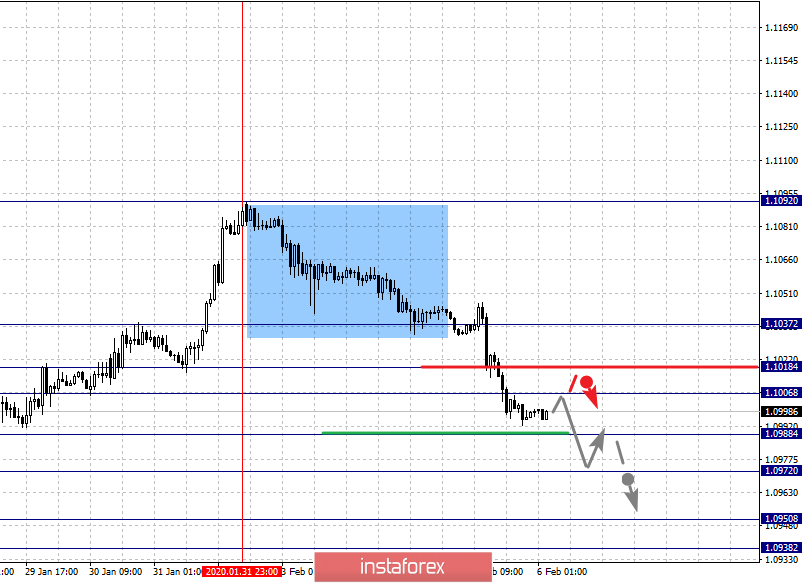
For the euro / dollar pair, the key levels on the H1 scale are: 1.1037, 1.1018, 1.1006, 1.0988, 1.0972, 1.0950 and 1.0938. Here, we are following the development of the descending structure of January 31. Short-term downward movement is expected in the range of 1.0988 - 1.0972. The breakdown of the last value will lead to a pronounced movement, Here, the target is 1.0950. For the potential value for the bottom, we consider the level of 1.0938. Upon reaching which, we expect consolidation, as well as a rollback to the top.
Short-term upward movement is possibly in the range 1.1006 - 1.1018. The breakdown of the latter value will lead to an in-depth correction. Here, the target is 1.1037. This level is a key support for the downward structure.
The main trend is the descending structure of January 31
Trading recommendations:
Buy: 1.1006 Take profit: 1.1018
Buy: 1.1020 Take profit: 1.1035
Sell: 1.0988 Take profit: 1.0974
Sell: 1.0970 Take profit: 1.0950
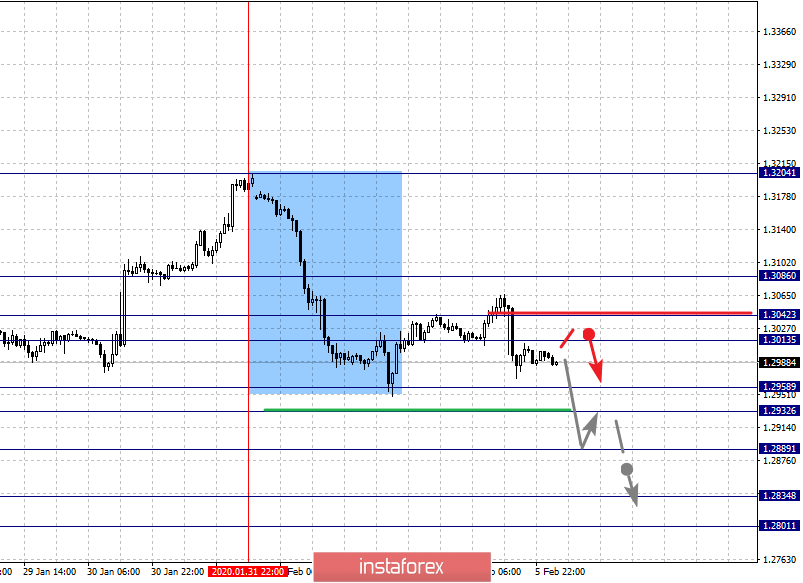
For the pound / dollar pair, the key levels on the H1 scale are: 1.3086, 1.3042, 1.3013, 1.2958, 1.2932, 1.2889 and 1.2834. Here, the price has canceled the development of the upward trend and at the moment we are following the development of the downward structure of January 31. Short-term downward movement is expected in the range of 1.2958 - 1.2932. The breakdown of the last value will lead to a movement to the level of 1.2889. Price consolidation is near this value. For the potential value for the bottom, we consider the level of 1.2834. Upon reaching this level, we expect a pullback to the top.
Short-term upward movement is possibly in the range of 1.3013 - 1.3042. The breakdown of the latter value will lead to an in-depth correction. Here, the target is 1.3086. This level is a key support for the top.
The main trend is the descending structure of January 31
Trading recommendations:
Buy: 1.3013 Take profit: 1.3040
Buy: 1.3043 Take profit: 1.3084
Sell: 1.2958 Take profit: 1.2933
Sell: 1.2931 Take profit: 1.2890
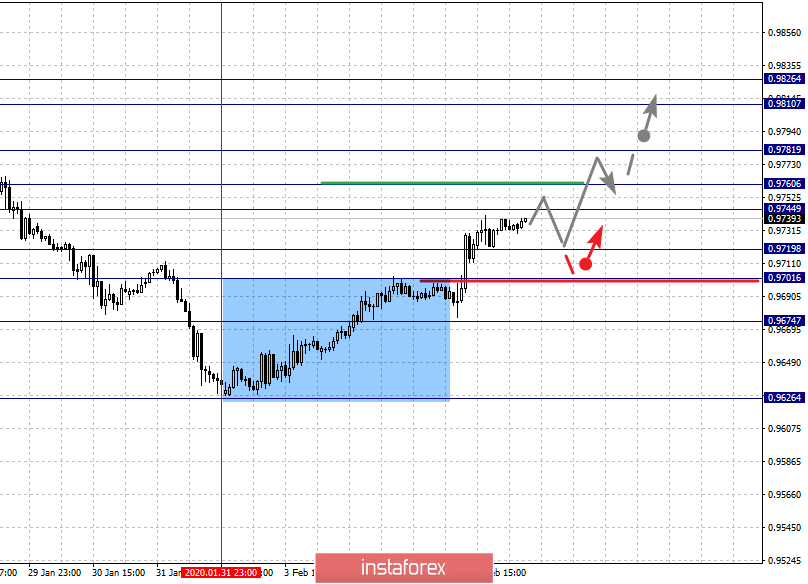
For the dollar / franc pair, the key levels on the H1 scale are: 0.9826, 0.9810, 0.9781, 0.9760, 0.9744, 0.9719, 0.9701 and 0.9674. Here, we are following the development of the ascending structure of January 31. The continuation of the movement to the top is expected after the price passes the noise range 0.9744 - 0.9760. In this case, the target is 0.9781. Price consolidation is near this level. The breakdown of the level of 0.9781 will lead to a pronounced movement. Here, the target is 0.9810. For the potential value for the top, we consider the level of 0.9826. Upon reaching which, we expect a pullback to the bottom.
Short-term downward movement is possibly in the range of 0.9719 - 0.9701. The breakdown of the latter value will lead to an in-depth correction. Here, the target is 0.9674. This level is a key support for the upward structure.
The main trend is the downward cycle of January 31
Trading recommendations:
Buy : 0.9760 Take profit: 0.9780
Buy : 0.9782 Take profit: 0.9810
Sell: 0.9719 Take profit: 0.9703
Sell: 0.9699 Take profit: 0.9676
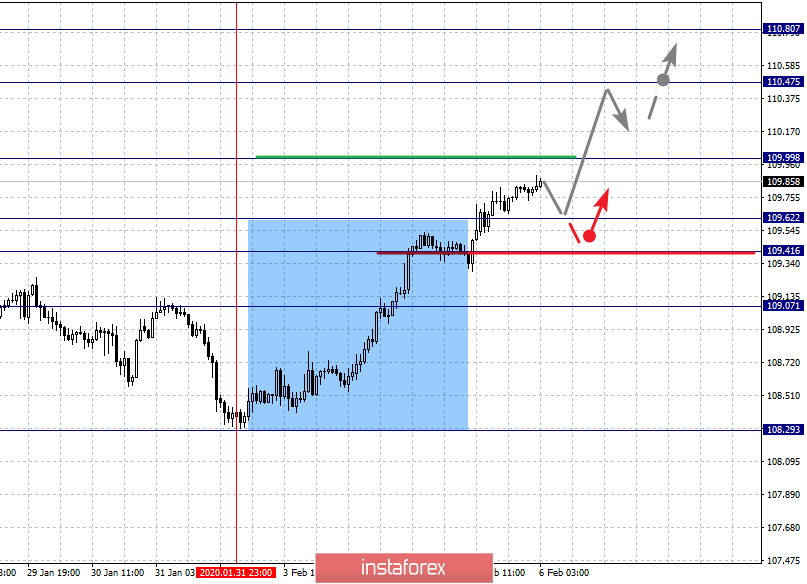
For the dollar / yen pair, the key levels on the scale are : 110.80, 110.47, 109.99, 109.62, 109.41 and 109.07. Here, we are following the development of the ascending structure of January 31. The continuation of the movement to the top is expected after the breakdown of the level of 110.00. In this case, the target is 110.47. Price consolidation is near this level. For the potential value for the top, we consider the level 110.80. Upon reaching which, we expect a pullback to the bottom.
Short-term downward movement is possibly in the range of 109.62 - 109.41. The breakdown of the last value will lead to an in-depth correction. Here, the goal is 109.07. This level is a key support for the top.
Main trend: upward structure of January 31
Trading recommendations:
Buy: 110.00 Take profit: 110.45
Buy : 110.49 Take profit: 110.80
Sell: 109.60 Take profit: 109.42
Sell: 109.38 Take profit: 109.10
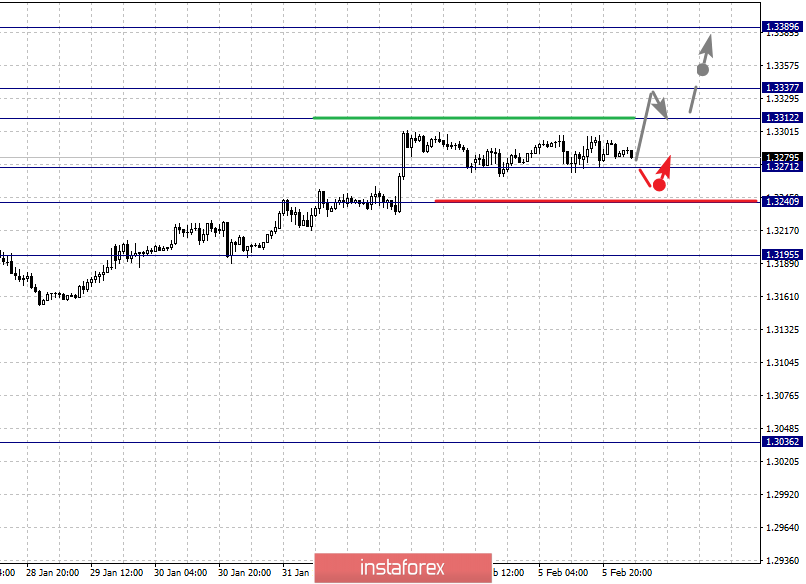
For the Canadian dollar / US dollar pair, the key levels on the H1 scale are: 1.3389, 1.3337, 1.3312, 1.3271, 1.3240 and 1.3195. Here, we are following the development of the upward cycle of January 22. Short-term upward movement is expected in the range of 1.3312 - 1.3337. Hence, there is a high probability of a turn to the bottom. For the potential value for the top, we consider the level of 1.3389. We expect movement to this level after the breakdown of the level of 1.3337.
Short-term downward movement is possibly in the range of 1.3271 - 1.3240. The breakdown of the last value will lead to an in-depth correction. Here, the target is 1.3195. This level is a key support for the top.
The main trend is the local ascending structure of January 22
Trading recommendations:
Buy: 1.3313 Take profit: 1.3335
Buy : 1.3337 Take profit: 1.3387
Sell: 1.3370 Take profit: 1.3242
Sell: 1.3238 Take profit: 1.3195
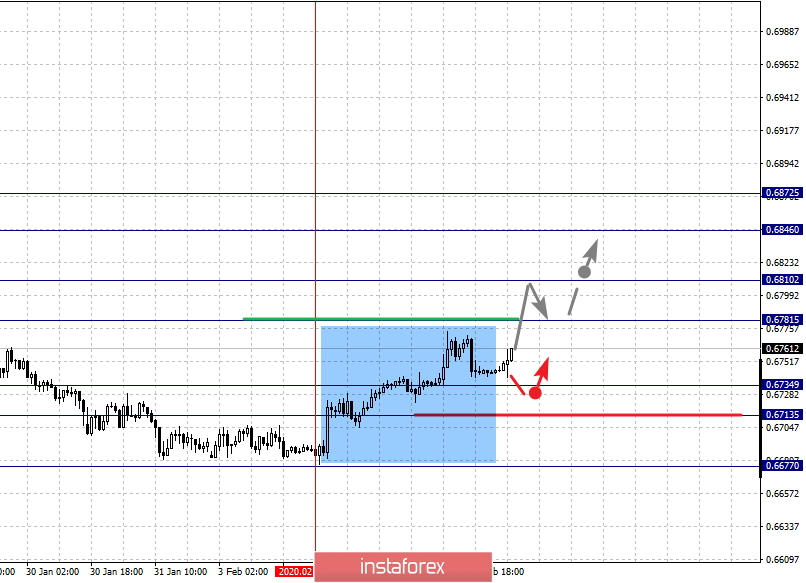
For the Australian dollar / US dollar pair, the key levels on the H1 scale are : 0.6872, 0.6846, 0.6810, 0.6781, 0.6734, 0.6713 and 0.6677. Here, we are following the formation of the ascending structure of February 4. The continuation of the movement to the top is expected after the breakdown of the level of 0.6781. In this case, the target is 0.6810. Price consolidation is near this level. The breakdown of the level of 0.6810 should be accompanied by a pronounced upward movement. Here, the target is 0.6846. For the potential value for the top, we consider the level of 0.6872. Upon reaching which, we expect a pullback to the bottom.
Short-term downward movement is expected in the range of 0.6734 - 0.6713. The breakdown of the latter value will have the downward structure formation. Here, the potential target is 0.6677.
The main trend is the formation of the ascending structure of February 4
Trading recommendations:
Buy: 0.6781 Take profit: 0.6810
Buy: 0.6812 Take profit: 0.6846
Sell : 0.6734 Take profit : 0.6715
Sell: 0.6710 Take profit: 0.6677
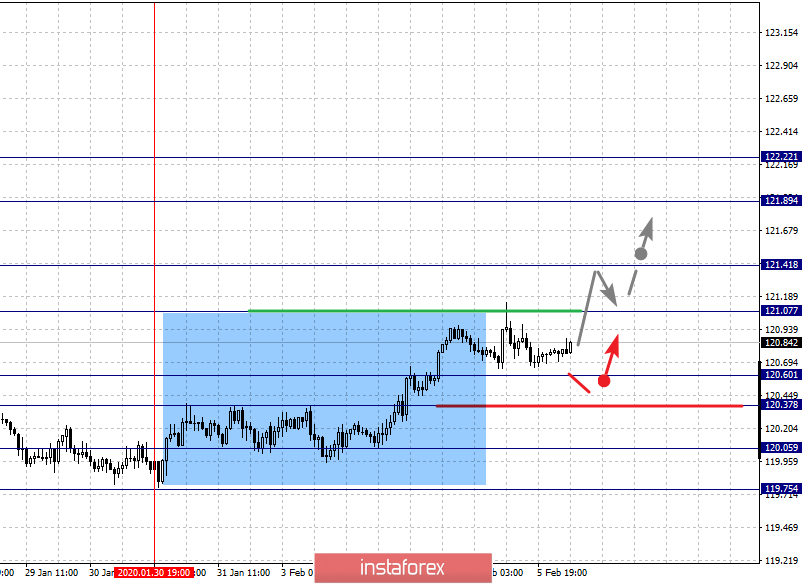
For the euro / yen pair, the key levels on the H1 scale are: 122.22, 121.89, 121.41, 121.07, 120.60, 120.37, 120.05 and 119.75. Here, we are following the formation of the ascending structure of January 30. The continuation of the movement to the top is expected after the breakdown of the level of 121.07. In this case, the goal is 121.41. Price consolidation is near this level. The breakdown of the level of 121.45 will lead to a pronounced upward movement. Here, the goal is 121.89. For the potential value for the top, we consider the level of 122.22. Upon reaching this level, we expect a pullback to the bottom.
Short-term downward movement is possibly in the range of 120.60 - 120.37. The breakdown of the last value will lead to an in-depth correction. Here, the goal is 120.05. This level is a key support for the top.
The main trend is the upward structure of January 30
Trading recommendations:
Buy: 121.08 Take profit: 121.40
Buy: 121.43 Take profit: 121.87
Sell: 120.60 Take profit: 120.39
Sell: 120.35 Take profit: 120.05
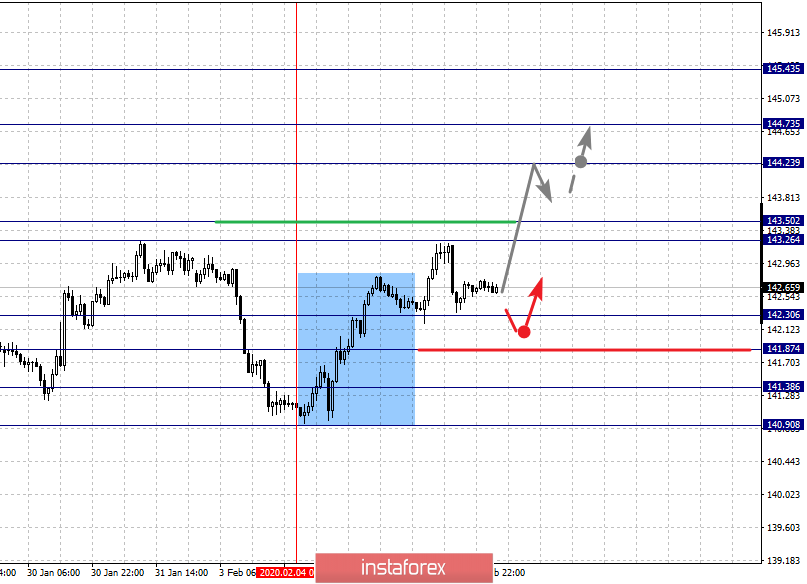
For the pound / yen pair, the key levels on the H1 scale are : 145.43, 144.73, 144.23, 143.50, 143.26, 142.30, 141.87, 141.38 and 140.90. Here, the price registered the expressed initial conditions for the top of February 4. The continuation of the movement to the top is expected after the price passes the noise range of 143.26 - 143.50. In this case, the goal is 144.23. Short-term upward movement, as well as consolidation is in the range of 144.23 - 144.73. For the potential value for the top, we consider the level of 145.43, upon reaching this level, we expect a pullback to the bottom.
Short-term downward movement is expected in the range of 142.30 - 141.87. The breakdown of the last value will lead to an in-depth correction. Here, the goal is 141.38. This level is a key support for the top.
The main trend is the initial conditions for the top of February 4
Trading recommendations:
Buy: 143.50 Take profit: 144.20
Buy: 144.25 Take profit: 144.70
Sell: 142.30 Take profit: 141.90
Sell: 141.85 Take profit: 141.40