Actual patterns
Patterns are graphical models which are formed in the chart by the price. According to one of the technical analysis postulates, history (price movement) repeats itself. It means that the price movements are often similar in the same situations which makes it possible to predict the further development of the situation with a high probability.
Actual Patterns
- All
- Double Top
- Flag
- Head and Shoulders
- Pennant
- Rectangle
- Triangle
- Triple top
- All
- #AAPL
- #AMZN
- #Bitcoin
- #EBAY
- #FB
- #GOOG
- #INTC
- #KO
- #MA
- #MCD
- #MSFT
- #NTDOY
- #PEP
- #TSLA
- #TWTR
- AUDCAD
- AUDCHF
- AUDJPY
- AUDUSD
- EURCAD
- EURCHF
- EURGBP
- EURJPY
- EURNZD
- EURRUB
- EURUSD
- GBPAUD
- GBPCHF
- GBPJPY
- GBPUSD
- GOLD
- NZDCAD
- NZDCHF
- NZDJPY
- NZDUSD
- SILVER
- USDCAD
- USDCHF
- USDJPY
- USDRUB
- All
- M5
- M15
- M30
- H1
- D1
- All
- Buy
- Sale
- All
- 1
- 2
- 3
- 4
- 5
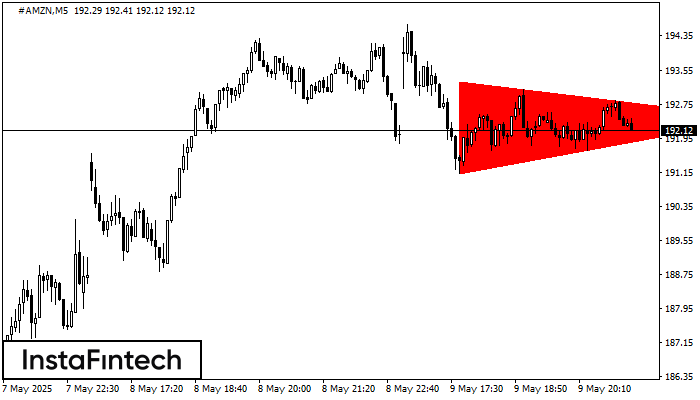
According to the chart of M5, #AMZN formed the Bearish Symmetrical Triangle pattern. Trading recommendations: A breach of the lower border 191.13 is likely to encourage a continuation
The M5 and M15 time frames may have more false entry points.
Open chart in a new window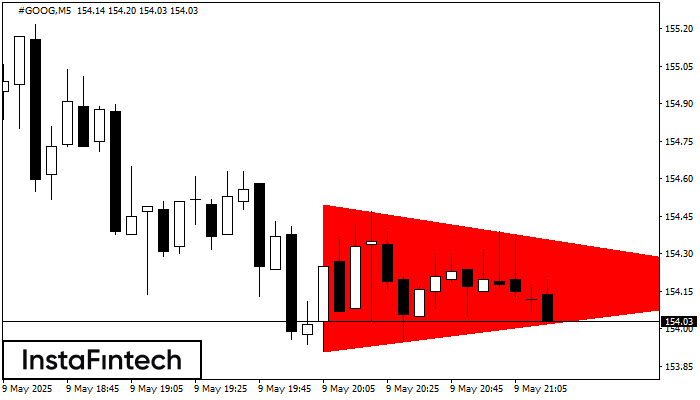
According to the chart of M5, #GOOG formed the Bearish Symmetrical Triangle pattern. This pattern signals a further downward trend in case the lower border 153.91 is breached. Here
The M5 and M15 time frames may have more false entry points.
Open chart in a new window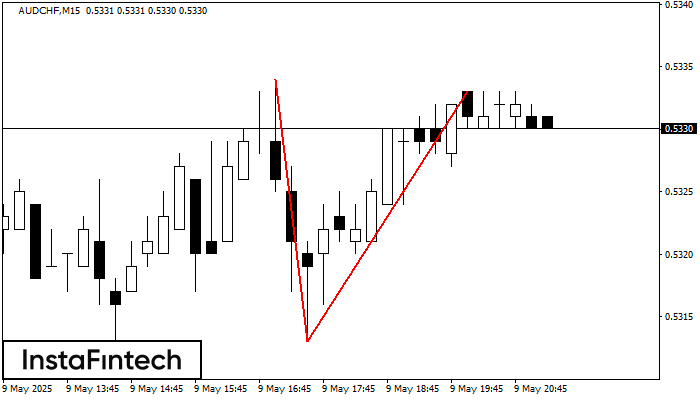
On the chart of AUDCHF M15 the Double Top reversal pattern has been formed. Characteristics: the upper boundary 0.5333; the lower boundary 0.5313; the width of the pattern 20 points
The M5 and M15 time frames may have more false entry points.
Open chart in a new window
According to the chart of M5, #PEP formed the Bearish Rectangle. The pattern indicates a trend continuation. The upper border is 130.78, the lower border is 130.41. The signal means
The M5 and M15 time frames may have more false entry points.
Open chart in a new window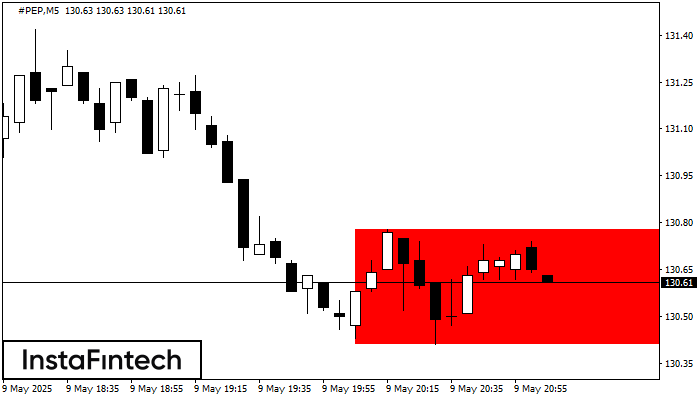
According to the chart of M5, #PEP formed the Bearish Rectangle which is a pattern of a trend continuation. The pattern is contained within the following borders: lower border 130.41
The M5 and M15 time frames may have more false entry points.
Open chart in a new window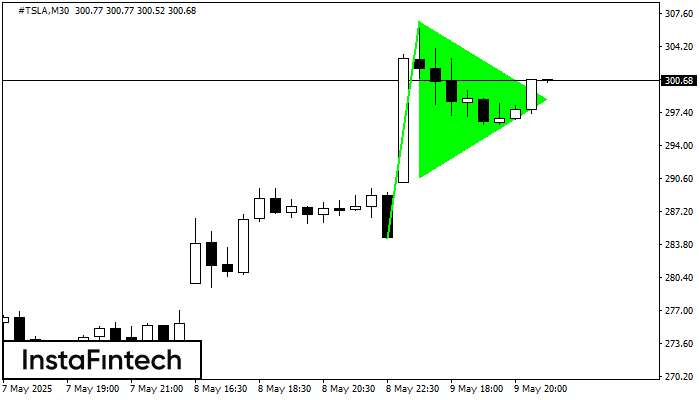
The Bullish pennant signal – Trading instrument #TSLA M30, continuation pattern. Forecast: it is possible to set up a buy position above the pattern’s high of 306.75, with the prospect
Open chart in a new window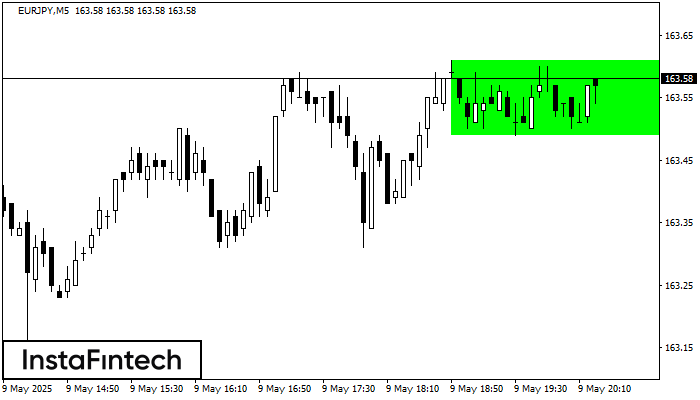
According to the chart of M5, EURJPY formed the Bullish Rectangle. The pattern indicates a trend continuation. The upper border is 163.61, the lower border is 163.49. The signal means
The M5 and M15 time frames may have more false entry points.
Open chart in a new window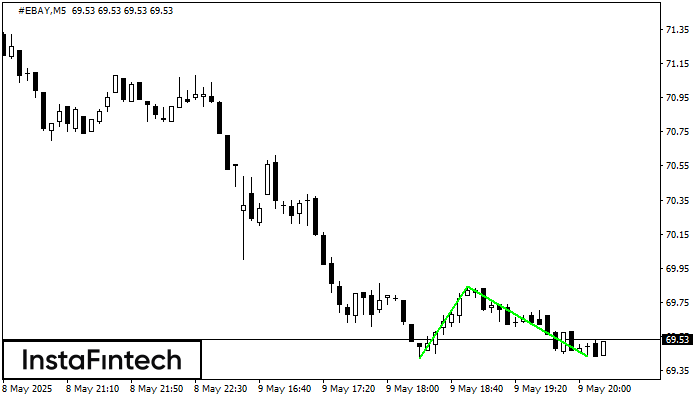
The Double Bottom pattern has been formed on #EBAY M5; the upper boundary is 69.84; the lower boundary is 69.43. The width of the pattern is 42 points. In case
The M5 and M15 time frames may have more false entry points.
Open chart in a new window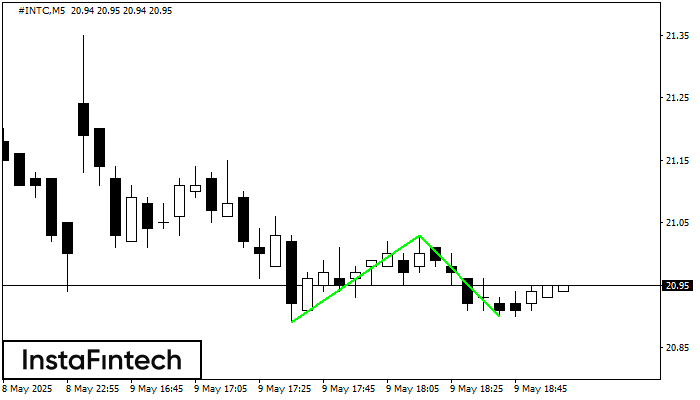
The Double Bottom pattern has been formed on #INTC M5; the upper boundary is 21.03; the lower boundary is 20.90. The width of the pattern is 14 points. In case
The M5 and M15 time frames may have more false entry points.
Open chart in a new window