signal strength 1 of 5
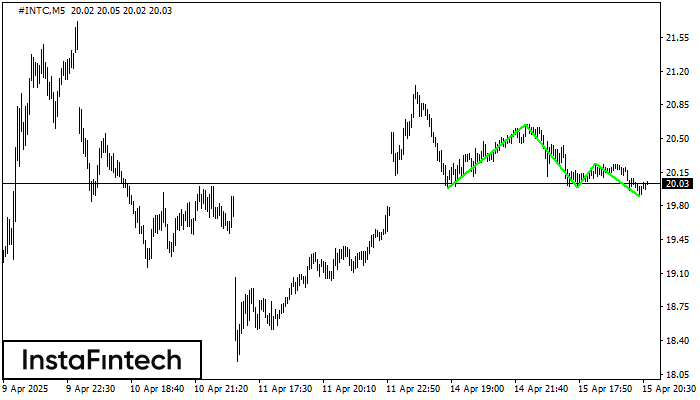
The Triple Bottom pattern has been formed on #INTC M5. It has the following characteristics: resistance level 20.65/20.24; support level 19.98/19.90; the width is 67 points. In the event of a breakdown of the resistance level of 20.65, the price is likely to continue an upward movement at least to 20.14.
The M5 and M15 time frames may have more false entry points.
- All
- Double Top
- Flag
- Head and Shoulders
- Pennant
- Rectangle
- Triangle
- Triple top
- All
- #AAPL
- #AMZN
- #Bitcoin
- #EBAY
- #FB
- #GOOG
- #INTC
- #KO
- #MA
- #MCD
- #MSFT
- #NTDOY
- #PEP
- #TSLA
- #TWTR
- AUDCAD
- AUDCHF
- AUDJPY
- AUDUSD
- EURCAD
- EURCHF
- EURGBP
- EURJPY
- EURNZD
- EURRUB
- EURUSD
- GBPAUD
- GBPCHF
- GBPJPY
- GBPUSD
- GOLD
- NZDCAD
- NZDCHF
- NZDJPY
- NZDUSD
- SILVER
- USDCAD
- USDCHF
- USDJPY
- USDRUB
- All
- M5
- M15
- M30
- H1
- D1
- All
- Buy
- Sale
- All
- 1
- 2
- 3
- 4
- 5
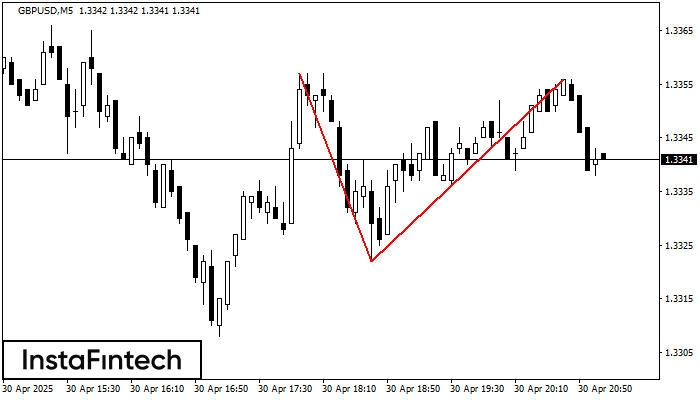
The Double Top reversal pattern has been formed on GBPUSD M5. Characteristics: the upper boundary 1.3357; the lower boundary 1.3322; the width of the pattern is 34 points. Sell trades
The M5 and M15 time frames may have more false entry points.
Open chart in a new window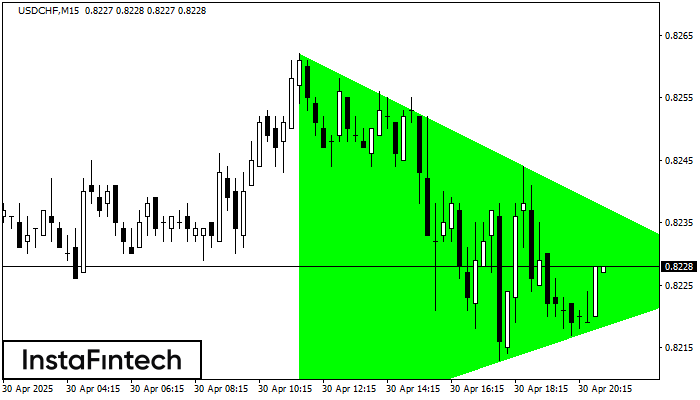
According to the chart of M15, USDCHF formed the Bullish Symmetrical Triangle pattern. Description: This is the pattern of a trend continuation. 0.8262 and 0.8202 are the coordinates
The M5 and M15 time frames may have more false entry points.
Open chart in a new window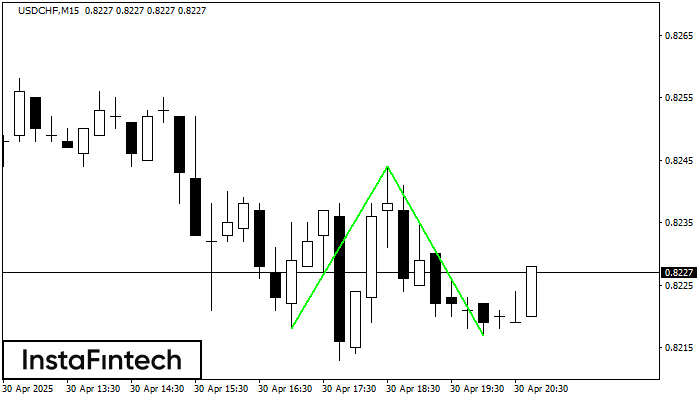
The Double Bottom pattern has been formed on USDCHF M15; the upper boundary is 0.8244; the lower boundary is 0.8217. The width of the pattern is 26 points. In case
The M5 and M15 time frames may have more false entry points.
Open chart in a new window