empty
26.09.2022 12:28 PM
Bitcoin forms a descending triangle pattern: will local bottom be updated?

Bitcoin spent the weekend consolidating within a narrow range. The decline in overall trading activity did not affect the cryptocurrency quotes in any way since the interest of retail investors is at a minimum. Bitcoin starts the new week with the formation of a dangerous bearish pattern near the $18.9k level.

After a powerful market crash on September 13 and the formation of one of the largest bearish candles in recent times, BTC/USD has taken a downward direction. On the daily chart of the cryptocurrency, we see a gradual narrowing of the range of fluctuations, which can have far-reaching consequences.

Is the market preparing to sink to the bottom?

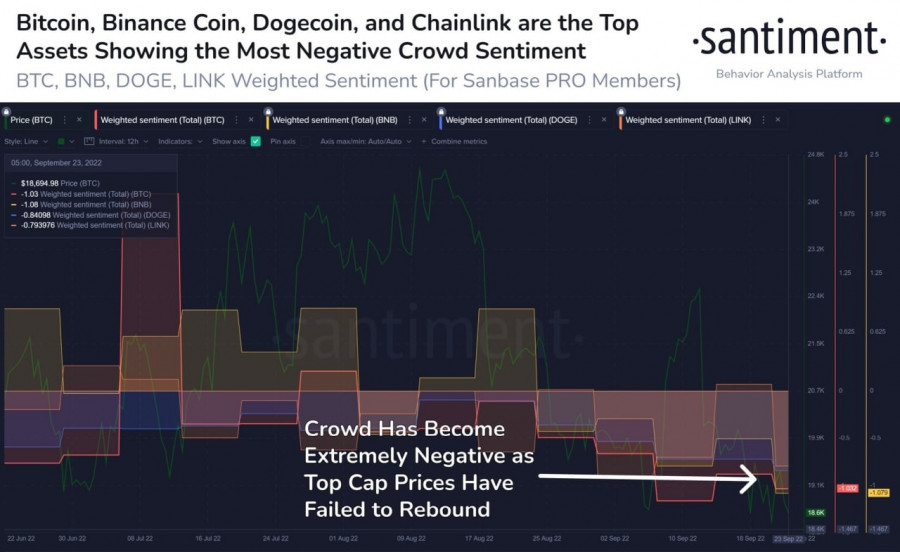
On September 22, buyers formed large volumes and converted them into a green candle. However, it was not possible to develop local success in the future. An unsuccessful attempt to carry out a local rebound exacerbated market sentiment. According to the Santiment report, the cryptocurrency market is experiencing extreme negative sentiment due to failed rebound attempts.

This image is no longer relevant

This leads investors to take concrete action to protect their interests near or below the local low at $17.7k. Each unsuccessful attempt to rebound leads to the saturation of the zone under the local bottom with liquidity. And judging by the price action on the daily chart, the market is gearing up to harvest below $17.7k.

Bitcoin Technical analysis

On the daily chart of BTC/USD, the price is tightening and a descending triangle pattern is forming. The breakdown of this figure will likely be a breakdown of the $17.7k level and an update of the local bottom.

Buying volumes are at their lowest level in the current bear market. Another increase in the key rate is forcing investors to sell their assets in order to avoid margin calls. The result is an ideal situation to update the local bottom and collect large amounts of liquidity below $17.7k.

The formation of a descending triangle may become a prerequisite for a subsequent update of the market bottom. Technical indicators generally show a lull, but, most likely, bearish pressure will resume with the opening of US markets.

Last week, the stochastic oscillator managed to break out of the oversold zone, but subsequently the metric again fell below the 20 level. This is another clear evidence of the weakness of the buyers and the lack of volume needed to protect $17.7k.

S&P 500 Analysis

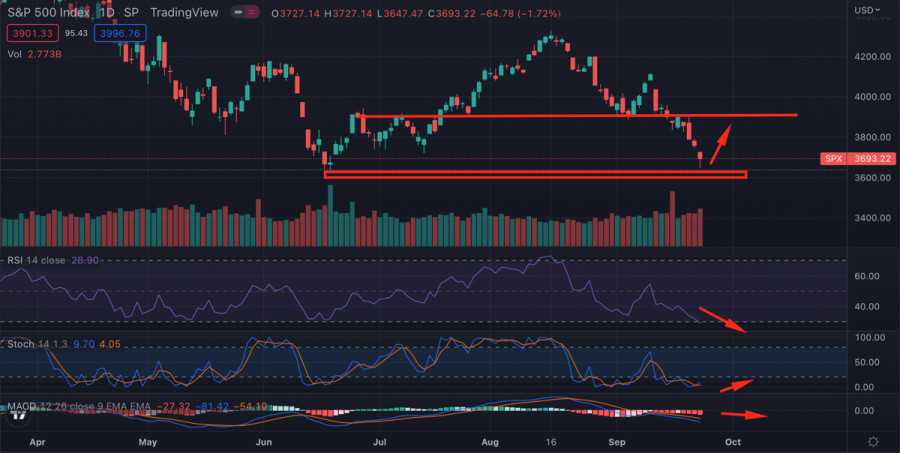
SPX continues to fall and reaches the key support zone at $3,640. Near this level, there are signs of activation of buyers. The bulls managed to move the price away from the important level and as of September 26, the index is trading near $3,700.

This image is no longer relevant

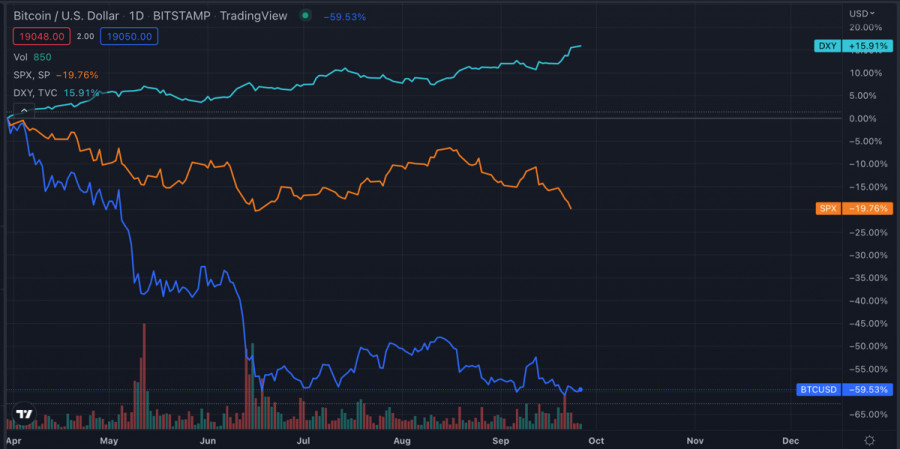
It is important to note that over the past few days, the correlation between Bitcoin and SPX has cracked. The stock index continued to decline while the cryptocurrency stubbornly resisted and remained in a tight range. Judging by the successful rebound of SPX, it will become clear in the near future whether BTC will follow the stock index in an upward movement.

DXY Analysis

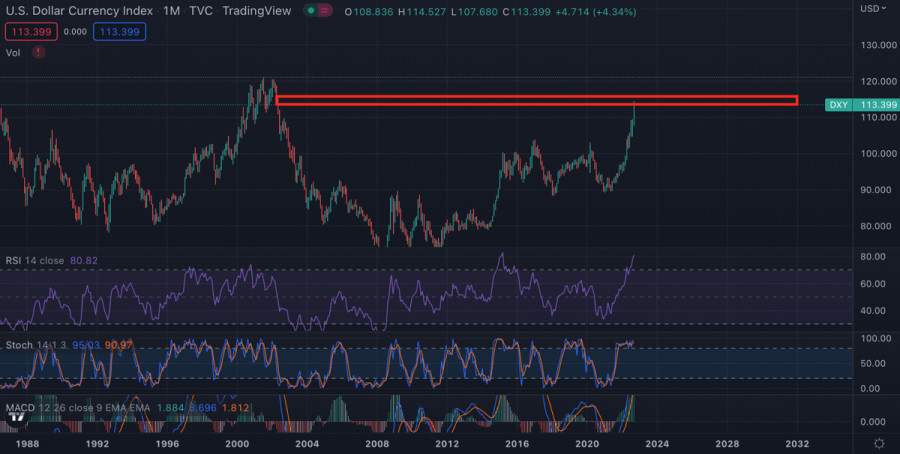
An interesting situation arose with the US dollar index. The asset peaked at 114.5 but subsequently faced increased selling pressure. On the monthly chart, we see that the price has almost reached the high of 2003–2004.

This image is no longer relevant

The technical metrics of the asset on the monthly chart are deep in the overbought zone. It is likely that we will soon face a serious correction in the DXY index, as the asset has reached an absolute peak in all indicators.

Conclusions

There is a high probability that Bitcoin will update the local low in the next two weeks. Technical metrics and another peak moment of negative news have a positive effect on the positions of sellers.

This image is no longer relevant

In the medium term, the markets may be overwhelmed by an upward trend. The impending DXY correction will exceed the drop in the price of the index during the month of the summer. In parallel with the corrective movement of the dollar index, the stock and crypto markets updated local highs. It is likely that we will observe a similar picture in the second half of autumn.

Artem Petrenko,
انسٹافاریکس کا تجزیاتی ماہر
© 2007-2025
ٹائم فریم منتخب کریں
5
منٹ
15
منٹ
30
منٹ
1
گھنٹہ
4
گھنٹے
1
دن
1
ہفتہ
انسٹافاریکس کے ساتھ کرپٹو کرنسی کی معاملاتی تبدیلیوں سے کمائیں۔
میٹا ٹریڈر 4 ڈاؤن لوڈ کریں اور اپنی پہلی ٹریڈ کھولیں۔
  • Grand Choice
    Contest by
    InstaForex
    InstaForex always strives to help you
    fulfill your biggest dreams.
    مقابلہ میں شامل ہوں

تجویز کردہ مضامین

بٹ کوائن کو نئی سطح پر جانے میں کیا مدد کر سکتا ہے

جبکہ بٹ کوائن—اور پوری کریپٹو کرنسی مارکیٹ—امریکی اقتصادی اعداد و شمار کا انتظار کر رہی ہے جو فیڈرل ریزرو کے راستے کو تشکیل دے سکتا ہے، گولڈمین

Jakub Novak 20:57 2025-04-30 UTC+2

بٹ کوائن: مئی کرپٹو مارکیٹ کے لیے محور کیوں بن سکتا ہے۔

جب کہ مالیاتی مرکزی دھارے کے بازار کے شرکاء کساد بازاری کے خطرات اور شرح سود پر غور کر رہے ہیں، بٹ کوائن مستقل بنیاد حاصل کر رہا ہے۔ اپریل

Ekaterina Kiseleva 20:30 2025-04-30 UTC+2

اپریل 30 کو کرپٹو کرنسی مارکیٹ کے لیے تجارتی سفارشات

بٹ کوائن اور ایتھریم کے خریدار مارکیٹ میں کمی کے اچھے لمحات سے فائدہ اٹھاتے رہتے ہیں اور اسے تیزی سے خریدتے ہیں، جیسا کہ آج ایشیائی تجارت کے دوران

Miroslaw Bawulski 16:50 2025-04-30 UTC+2

بٹ کوائن اور ایتھر بدستور مضبوط ہیں

بٹ کوائن اور ایتھر میں کل کی تیزی سے انٹرا ڈے گراوٹ تیزی سے خریدی گئی، جو تاجروں اور سرمایہ کاروں کی جانب سے جاری دلچسپی کا اشارہ

Jakub Novak 16:39 2025-04-30 UTC+2

سال کے اختتام تک بی ٹی سی ممکنہ طور پر 200000 ڈالر تک چلا جائے گا

جب کہ بٹ کوائن اب بھی $95,000 کی سطح کو توڑنے کے لیے جدوجہد کر رہا ہے — تمام شرائط کے موجود ہونے کے باوجود — سٹینڈرڈ چارٹرڈ کا خیال

Jakub Novak 19:49 2025-04-29 UTC+2

اپریل 29 2025 کو بی ٹی سی / یو ایس ڈی کا تجزیہ

بی ٹی سی / یو ایس ڈی کے 4 گھنٹے کے چارٹ پر لہر کا نمونہ کچھ زیادہ پیچیدہ ہو گیا ہے۔ ہم نے ایک اصلاحی نیچے کی طرف ڈھانچے

Chin Zhao 19:46 2025-04-29 UTC+2

اپریل 28 کو کرپٹو کرنسی مارکیٹ کے لیے تجارتی سفارشات

بٹ کوائن پر دباؤ ڈالا جا رہا ہے، لیکن یہ اب بھی کافی اعتماد کے ساتھ برقرار ہے۔ $92,000 کے نشان سے ری باؤنڈ کرنے کے بعد، پہلی کریپٹو کرنسی

Miroslaw Bawulski 18:45 2025-04-28 UTC+2

ایکس آر پی فیوچرز 19 مئی کو شروع ہونے والے ہیں

ہفتے کے آخر میں، بٹ کوائن نے ایک مختصر کمی کا تجربہ کیا لیکن جلد ہی $94,000 کی سطح پر واپس آ گیا۔ ایتھر کو بھی کچھ دباؤ کا سامنا

Jakub Novak 18:38 2025-04-28 UTC+2

اپریل 23 کو کرپٹو کرنسی مارکیٹ کے لیے تجارتی سفارشات

بٹ کوائن نے کامیابی کے ساتھ $90,000 سے اوپر دھکیل دیا ہے، جب کہ ایتھریم نے صرف ایک دن میں 10% سے زیادہ کا اضافہ کیا، جو کہ $1800

Miroslaw Bawulski 15:48 2025-04-23 UTC+2
ابھی فوری بات نہیں کرسکتے ؟
اپنا سوال پوچھیں بذریعہ چیٹ.
Widget callback
 

Dear visitor,

Your IP address shows that you are currently located in the USA. If you are a resident of the United States, you are prohibited from using the services of InstaFintech Group including online trading, online transfers, deposit/withdrawal of funds, etc.

If you think you are seeing this message by mistake and your location is not the US, kindly proceed to the website. Otherwise, you must leave the website in order to comply with government restrictions.

Why does your IP address show your location as the USA?

  • - you are using a VPN provided by a hosting company based in the United States;
  • - your IP does not have proper WHOIS records;
  • - an error occurred in the WHOIS geolocation database.

Please confirm whether you are a US resident or not by clicking the relevant button below. If you choose the wrong option, being a US resident, you will not be able to open an account with InstaForex anyway.

We are sorry for any inconvenience caused by this message.