signal strength 1 of 5
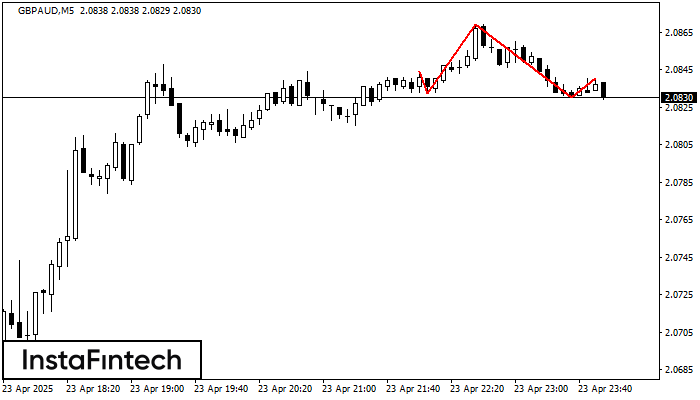
According to the chart of M5, GBPAUD formed the Head and Shoulders pattern. The Head’s top is set at 2.0869 while the median line of the Neck is found at 2.0832/2.0830. The formation of the Head and Shoulders pattern evidently signals a reversal of the upward trend. In other words, in case the scenario comes true, the price of GBPAUD will go towards 2.0815.
The M5 and M15 time frames may have more false entry points.
- All
- Double Top
- Flag
- Head and Shoulders
- Pennant
- Rectangle
- Triangle
- Triple top
- All
- #AAPL
- #AMZN
- #Bitcoin
- #EBAY
- #FB
- #GOOG
- #INTC
- #KO
- #MA
- #MCD
- #MSFT
- #NTDOY
- #PEP
- #TSLA
- #TWTR
- AUDCAD
- AUDCHF
- AUDJPY
- AUDUSD
- EURCAD
- EURCHF
- EURGBP
- EURJPY
- EURNZD
- EURRUB
- EURUSD
- GBPAUD
- GBPCHF
- GBPJPY
- GBPUSD
- GOLD
- NZDCAD
- NZDCHF
- NZDJPY
- NZDUSD
- SILVER
- USDCAD
- USDCHF
- USDJPY
- USDRUB
- All
- M5
- M15
- M30
- H1
- D1
- All
- Buy
- Sale
- All
- 1
- 2
- 3
- 4
- 5
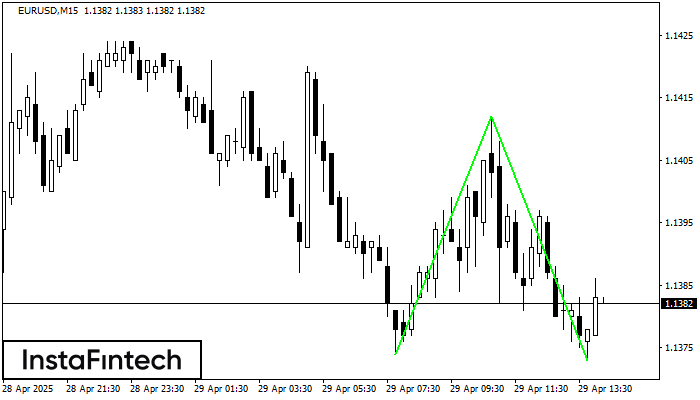
The Double Bottom pattern has been formed on EURUSD M15. Characteristics: the support level 1.1374; the resistance level 1.1412; the width of the pattern 38 points. If the resistance level
The M5 and M15 time frames may have more false entry points.
Open chart in a new window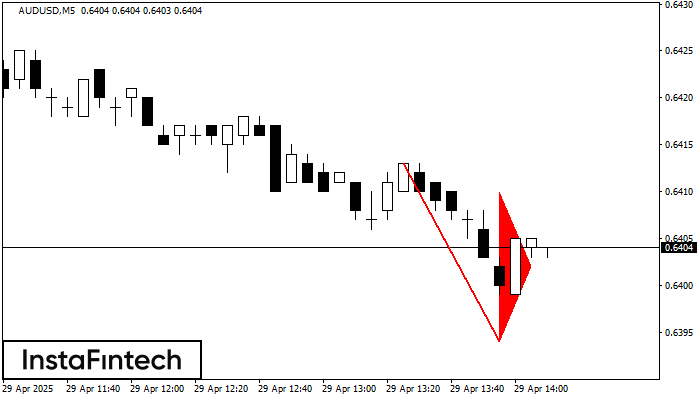
The Bearish pennant pattern has formed on the AUDUSD M5 chart. The pattern signals continuation of the downtrend in case the pennant’s low of 0.6394 is broken through. Recommendations: Place
The M5 and M15 time frames may have more false entry points.
Open chart in a new window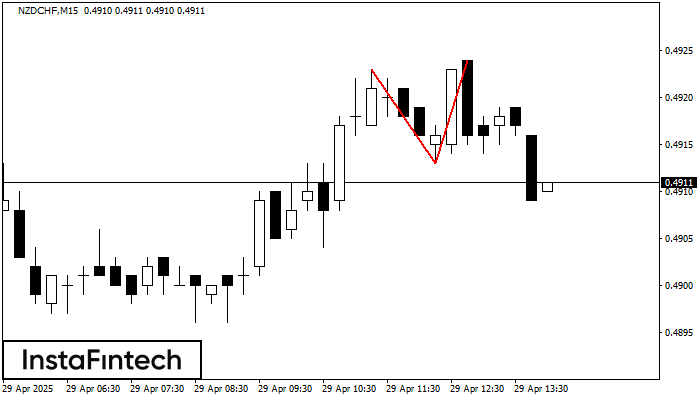
The Double Top reversal pattern has been formed on NZDCHF M15. Characteristics: the upper boundary 0.4923; the lower boundary 0.4913; the width of the pattern is 11 points. Sell trades
The M5 and M15 time frames may have more false entry points.
Open chart in a new window