signal strength 2 of 5
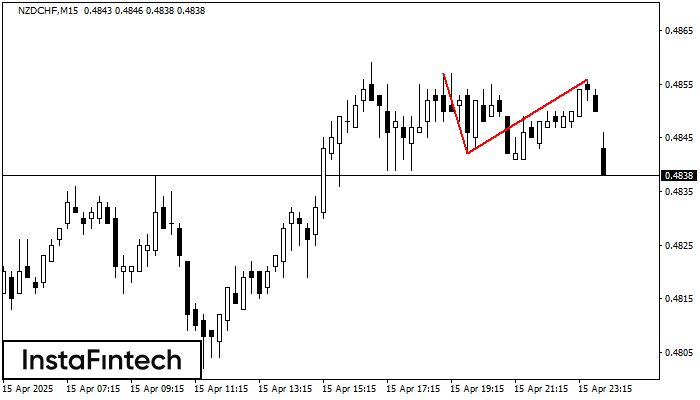
The Double Top pattern has been formed on NZDCHF M15. It signals that the trend has been changed from upwards to downwards. Probably, if the base of the pattern 0.4842 is broken, the downward movement will continue.
The M5 and M15 time frames may have more false entry points.
- All
- Double Top
- Flag
- Head and Shoulders
- Pennant
- Rectangle
- Triangle
- Triple top
- All
- #AAPL
- #AMZN
- #Bitcoin
- #EBAY
- #FB
- #GOOG
- #INTC
- #KO
- #MA
- #MCD
- #MSFT
- #NTDOY
- #PEP
- #TSLA
- #TWTR
- AUDCAD
- AUDCHF
- AUDJPY
- AUDUSD
- EURCAD
- EURCHF
- EURGBP
- EURJPY
- EURNZD
- EURRUB
- EURUSD
- GBPAUD
- GBPCHF
- GBPJPY
- GBPUSD
- GOLD
- NZDCAD
- NZDCHF
- NZDJPY
- NZDUSD
- SILVER
- USDCAD
- USDCHF
- USDJPY
- USDRUB
- All
- M5
- M15
- M30
- H1
- D1
- All
- Buy
- Sale
- All
- 1
- 2
- 3
- 4
- 5

The Bullish Flag pattern has been formed on the chart #NTDOY M30 which signals that the upward trend will continue. Signals: а break of the peak at 20.76 may push
Open chart in a new window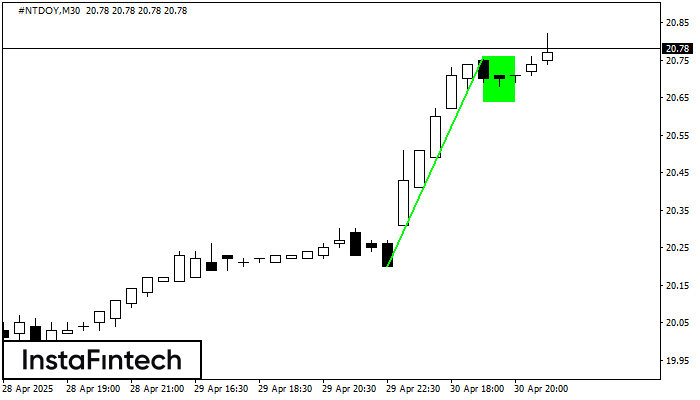
The Bullish Flag pattern which signals continuation of a trend has been formed on the chart #NTDOY M30. Forecast: if the price breaks above the pattern high at 20.76, then
Open chart in a new window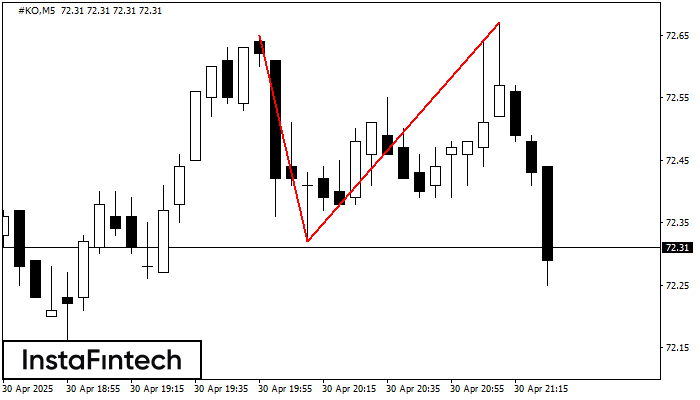
The Double Top reversal pattern has been formed on #KO M5. Characteristics: the upper boundary 72.65; the lower boundary 72.32; the width of the pattern is 35 points. Sell trades
The M5 and M15 time frames may have more false entry points.
Open chart in a new window