Actual patterns
Patterns are graphical models which are formed in the chart by the price. According to one of the technical analysis postulates, history (price movement) repeats itself. It means that the price movements are often similar in the same situations which makes it possible to predict the further development of the situation with a high probability.
Actual Patterns
- All
- Double Top
- Flag
- Head and Shoulders
- Pennant
- Rectangle
- Triangle
- Triple top
- All
- #AAPL
- #AMZN
- #Bitcoin
- #EBAY
- #FB
- #GOOG
- #INTC
- #KO
- #MA
- #MCD
- #MSFT
- #NTDOY
- #PEP
- #TSLA
- #TWTR
- AUDCAD
- AUDCHF
- AUDJPY
- AUDUSD
- EURCAD
- EURCHF
- EURGBP
- EURJPY
- EURNZD
- EURRUB
- EURUSD
- GBPAUD
- GBPCHF
- GBPJPY
- GBPUSD
- GOLD
- NZDCAD
- NZDCHF
- NZDJPY
- NZDUSD
- SILVER
- USDCAD
- USDCHF
- USDJPY
- USDRUB
- All
- M5
- M15
- M30
- H1
- D1
- All
- Buy
- Sale
- All
- 1
- 2
- 3
- 4
- 5
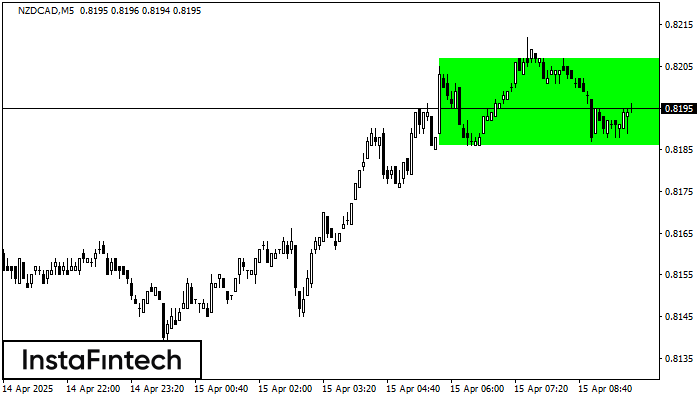
According to the chart of M5, NZDCAD formed the Bullish Rectangle. The pattern indicates a trend continuation. The upper border is 0.8207, the lower border is 0.8186. The signal means
The M5 and M15 time frames may have more false entry points.
Open chart in a new window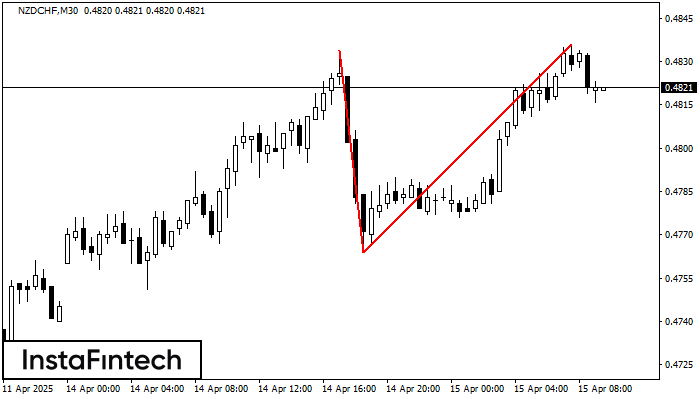
On the chart of NZDCHF M30 the Double Top reversal pattern has been formed. Characteristics: the upper boundary 0.4836; the lower boundary 0.4764; the width of the pattern 72 points
Open chart in a new window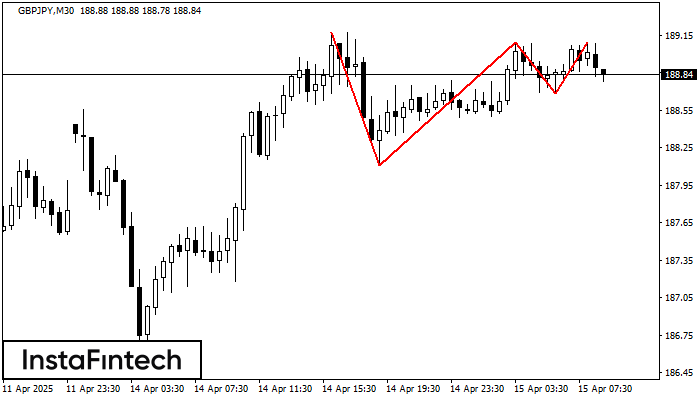
On the chart of the GBPJPY M30 trading instrument, the Triple Top pattern that signals a trend change has formed. It is possible that after formation of the third peak
Open chart in a new window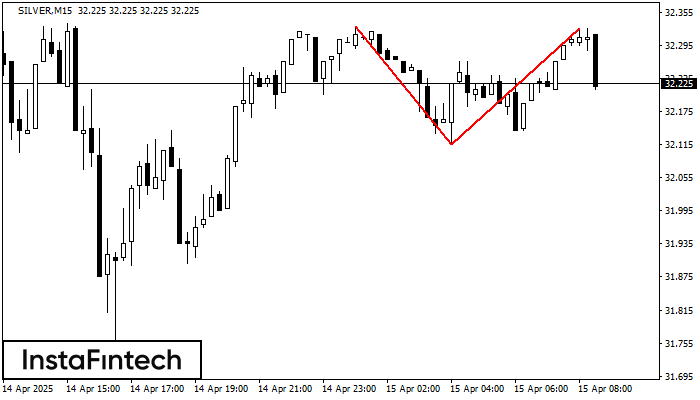
The Double Top pattern has been formed on SILVER M15. It signals that the trend has been changed from upwards to downwards. Probably, if the base of the pattern 32.12
The M5 and M15 time frames may have more false entry points.
Open chart in a new window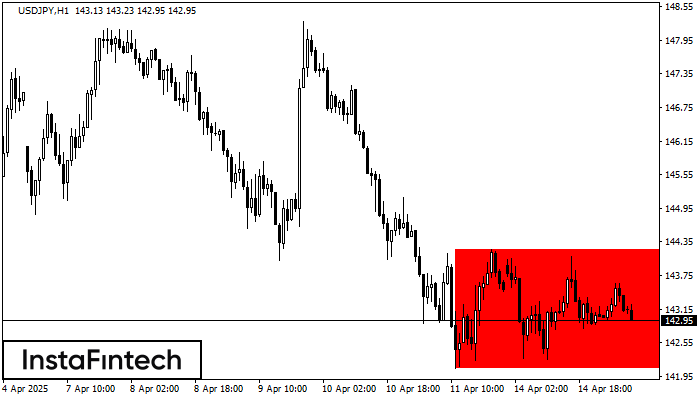
According to the chart of H1, USDJPY formed the Bearish Rectangle. The pattern indicates a trend continuation. The upper border is 144.21, the lower border is 142.08. The signal means
Open chart in a new window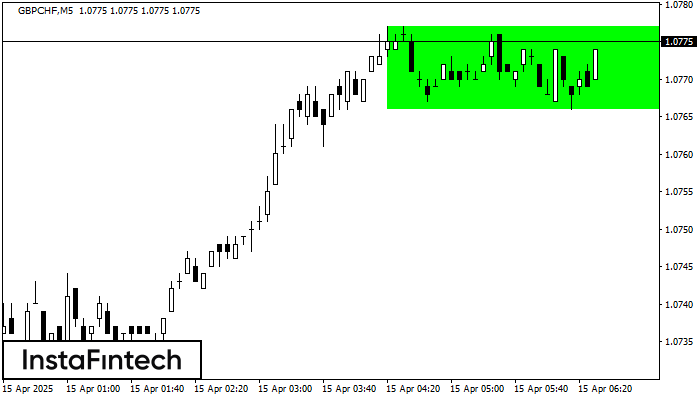
According to the chart of M5, GBPCHF formed the Bullish Rectangle which is a pattern of a trend continuation. The pattern is contained within the following borders: the lower border
The M5 and M15 time frames may have more false entry points.
Open chart in a new window
The Bearish pennant pattern has formed on the GBPAUD M5 chart. This pattern type is characterized by a slight slowdown after which the price will move in the direction
The M5 and M15 time frames may have more false entry points.
Open chart in a new window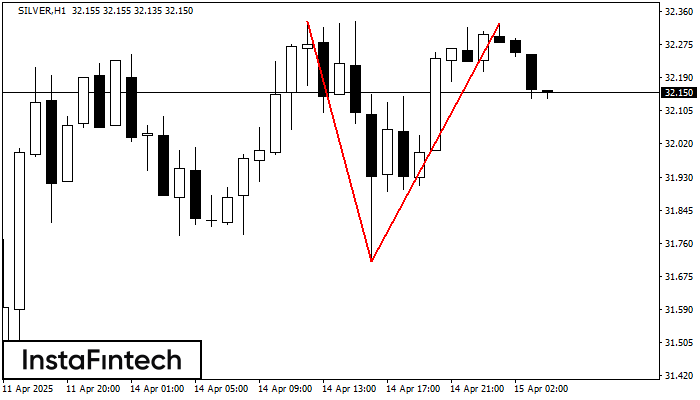
On the chart of SILVER H1 the Double Top reversal pattern has been formed. Characteristics: the upper boundary 32.33; the lower boundary 31.71; the width of the pattern 615 points
Open chart in a new window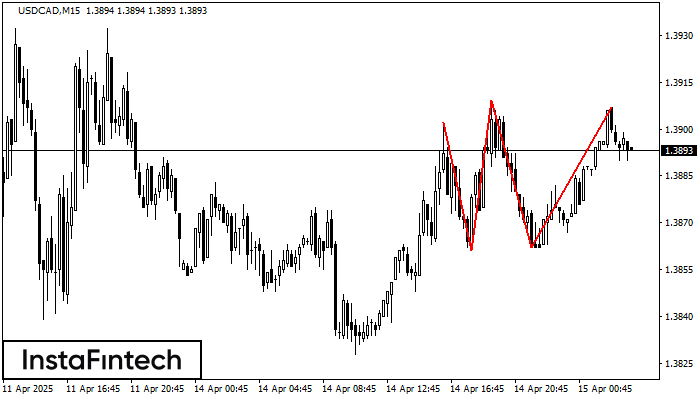
The Triple Top pattern has formed on the chart of the USDCAD M15 trading instrument. It is a reversal pattern featuring the following characteristics: resistance level -5, support level -1
The M5 and M15 time frames may have more false entry points.
Open chart in a new window