Actual patterns
Patterns are graphical models which are formed in the chart by the price. According to one of the technical analysis postulates, history (price movement) repeats itself. It means that the price movements are often similar in the same situations which makes it possible to predict the further development of the situation with a high probability.
Actual Patterns
- All
- Double Top
- Flag
- Head and Shoulders
- Pennant
- Rectangle
- Triangle
- Triple top
- All
- #AAPL
- #AMZN
- #Bitcoin
- #EBAY
- #FB
- #GOOG
- #INTC
- #KO
- #MA
- #MCD
- #MSFT
- #NTDOY
- #PEP
- #TSLA
- #TWTR
- AUDCAD
- AUDCHF
- AUDJPY
- AUDUSD
- EURCAD
- EURCHF
- EURGBP
- EURJPY
- EURNZD
- EURRUB
- EURUSD
- GBPAUD
- GBPCHF
- GBPJPY
- GBPUSD
- GOLD
- NZDCAD
- NZDCHF
- NZDJPY
- NZDUSD
- SILVER
- USDCAD
- USDCHF
- USDJPY
- USDRUB
- All
- M5
- M15
- M30
- H1
- D1
- All
- Buy
- Sale
- All
- 1
- 2
- 3
- 4
- 5
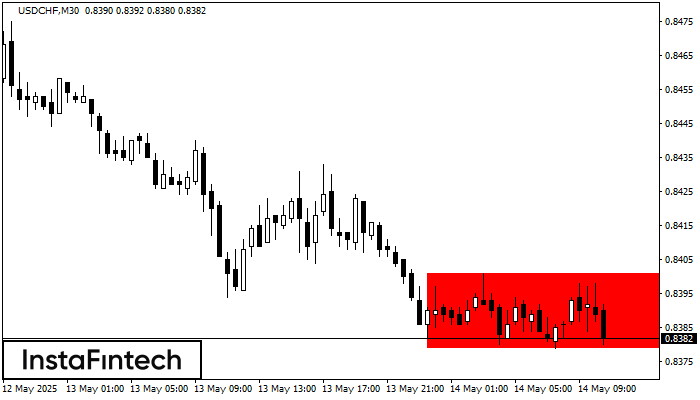
According to the chart of M30, USDCHF formed the Bearish Rectangle which is a pattern of a trend continuation. The pattern is contained within the following borders: lower border 0.8379
Open chart in a new window
According to the chart of M5, EURJPY formed the Inverse Head and Shoulder pattern. The Head’s top is set at 164.66 while the median line of the Neck is found
The M5 and M15 time frames may have more false entry points.
Open chart in a new window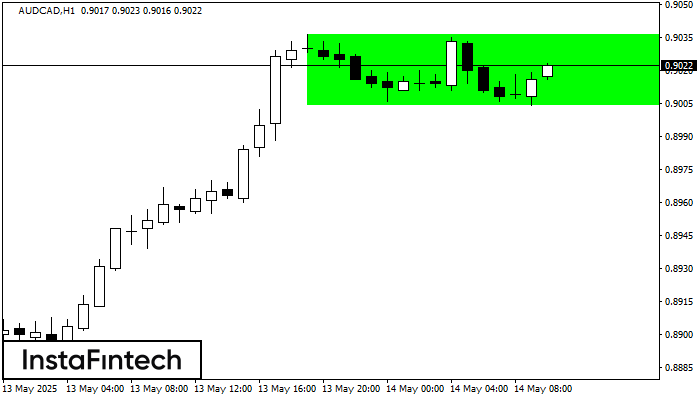
According to the chart of H1, AUDCAD formed the Bullish Rectangle. The pattern indicates a trend continuation. The upper border is 0.9036, the lower border is 0.9004. The signal means
Open chart in a new window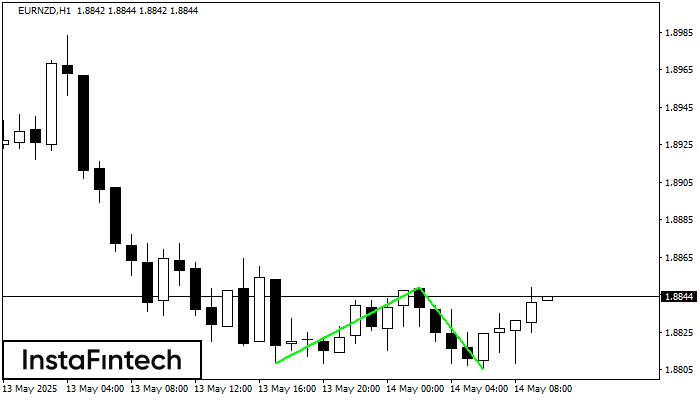
The Double Bottom pattern has been formed on EURNZD H1. This formation signals a reversal of the trend from downwards to upwards. The signal is that a buy trade should
Open chart in a new window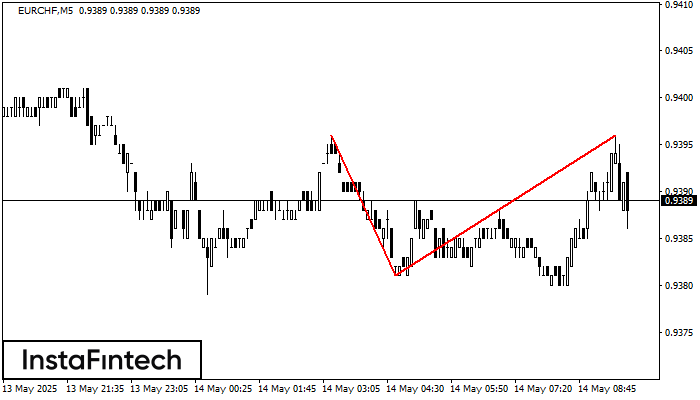
On the chart of EURCHF M5 the Double Top reversal pattern has been formed. Characteristics: the upper boundary 0.9396; the lower boundary 0.9381; the width of the pattern 15 points
The M5 and M15 time frames may have more false entry points.
Open chart in a new window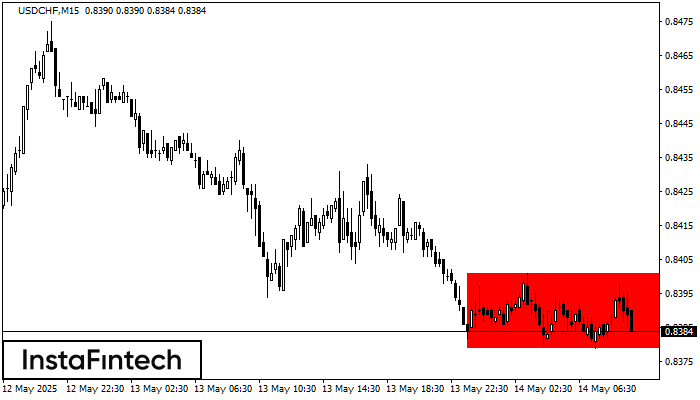
According to the chart of M15, USDCHF formed the Bearish Rectangle. The pattern indicates a trend continuation. The upper border is 0.8401, the lower border is 0.8379. The signal means
The M5 and M15 time frames may have more false entry points.
Open chart in a new window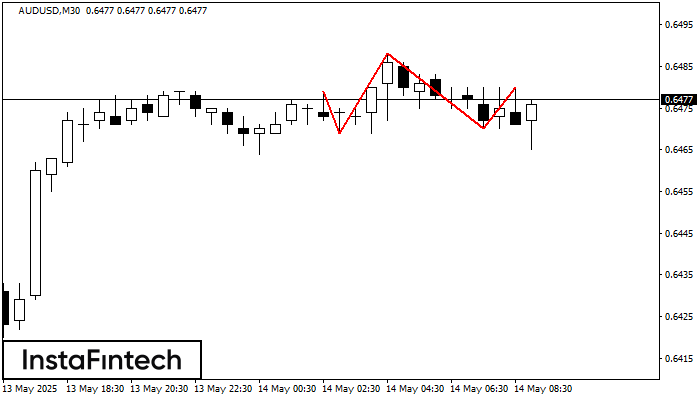
According to the chart of M30, AUDUSD formed the Head and Shoulders pattern. The Head’s top is set at 0.6488 while the median line of the Neck is found
Open chart in a new window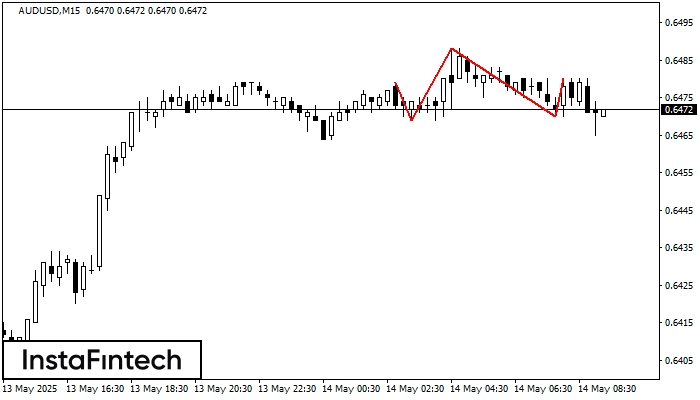
The technical pattern called Head and Shoulders has appeared on the chart of AUDUSD M15. There are weighty reasons to suggest that the price will surpass the Neckline 0.6469/0.6470 after
The M5 and M15 time frames may have more false entry points.
Open chart in a new window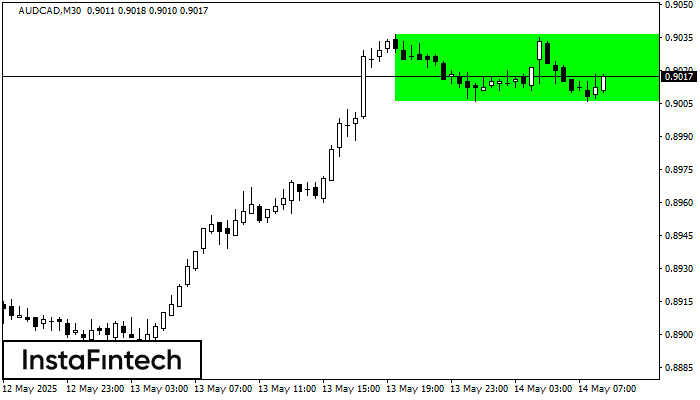
According to the chart of M30, AUDCAD formed the Bullish Rectangle. This type of a pattern indicates a trend continuation. It consists of two levels: resistance 0.9036 and support 0.9006
Open chart in a new window