signal strength 2 of 5
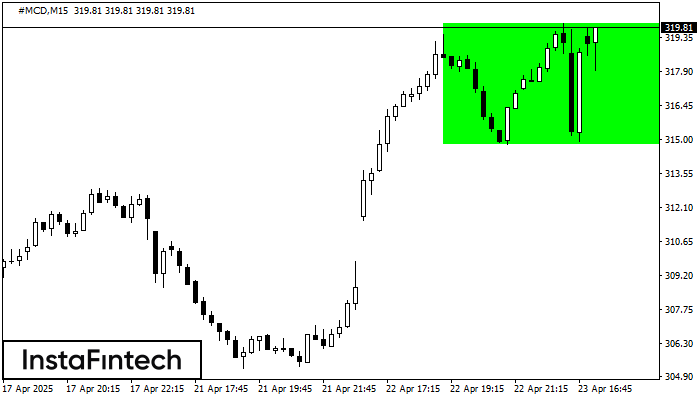
According to the chart of M15, #MCD formed the Bullish Rectangle. The pattern indicates a trend continuation. The upper border is 319.97, the lower border is 314.80. The signal means that a long position should be opened above the upper border 319.97 of the Bullish Rectangle.
The M5 and M15 time frames may have more false entry points.
Juga lihat
- All
- Double Top
- Flag
- Head and Shoulders
- Pennant
- Rectangle
- Triangle
- Triple top
- All
- #AAPL
- #AMZN
- #Bitcoin
- #EBAY
- #FB
- #GOOG
- #INTC
- #KO
- #MA
- #MCD
- #MSFT
- #NTDOY
- #PEP
- #TSLA
- #TWTR
- AUDCAD
- AUDCHF
- AUDJPY
- AUDUSD
- EURCAD
- EURCHF
- EURGBP
- EURJPY
- EURNZD
- EURRUB
- EURUSD
- GBPAUD
- GBPCHF
- GBPJPY
- GBPUSD
- GOLD
- NZDCAD
- NZDCHF
- NZDJPY
- NZDUSD
- SILVER
- USDCAD
- USDCHF
- USDJPY
- USDRUB
- All
- M5
- M15
- M30
- H1
- D1
- All
- Buy
- Sale
- All
- 1
- 2
- 3
- 4
- 5
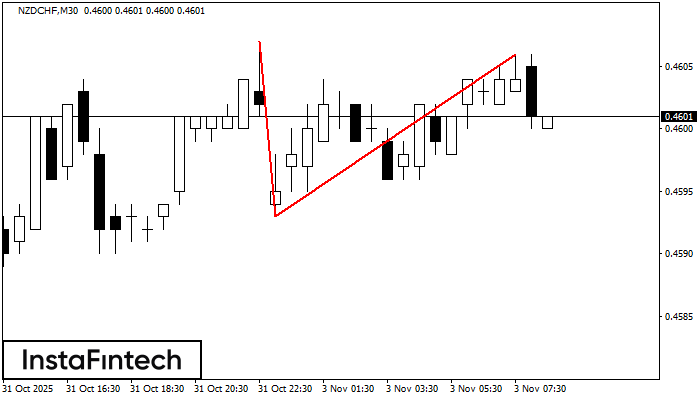
Corak pembalikan Double Top telah dibentuk pada NZDCHF M30. Ciri-ciri: sempadan atas %P0.000000; sempadan bawah 0.4607; sempadan bawah 0.4593; lebar corak adalah 13 mata. Dagangan menjual adalah lebih baik untuk
Open chart in a new window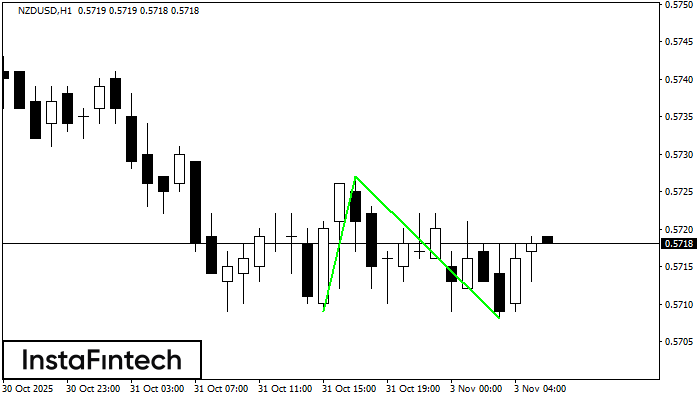
Corak Double Bottom telah dibentuk pada NZDUSD H1. Pembentukan ini menandakan pembalikan aliran dari aliran menurun ke atas. Isyarat ialah perdagangan membeli harus dibuka selepas sempadan atas corak 0.5727 telah
Open chart in a new window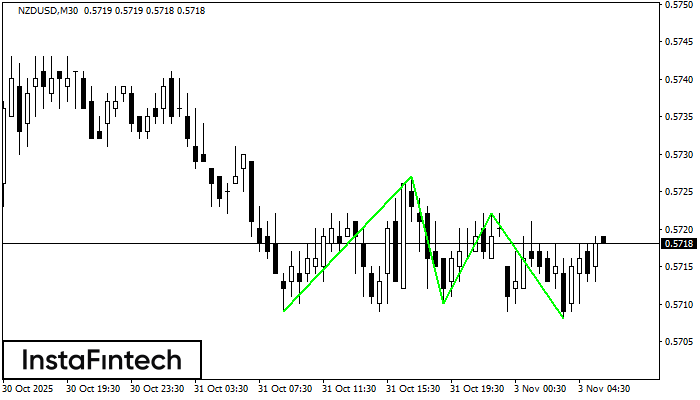
Corak Triple Bottom telah dibentuk pada carta NZDUSD M30. Ciri-ciri corak: Garisan bawah corak mempunyai koordinat 0.5727 dengan had atas 0.5727/0.5722, unjuran lebar adalah 18 mata. Pembentukan corak Triple Bottom
Open chart in a new window