signal strength 3 of 5

The Triple Bottom pattern has formed on the chart of AUDCHF M30. Features of the pattern: The lower line of the pattern has coordinates 0.5232 with the upper limit 0.5232/0.5218, the projection of the width is 26 points. The formation of the Triple Bottom pattern most likely indicates a change in the trend from downward to upward. This means that in the event of a breakdown of the resistance level 0.5206, the price is most likely to continue the upward movement.
See Also
- All
- Double Top
- Flag
- Head and Shoulders
- Pennant
- Rectangle
- Triangle
- Triple top
- All
- #AAPL
- #AMZN
- #Bitcoin
- #EBAY
- #FB
- #GOOG
- #INTC
- #KO
- #MA
- #MCD
- #MSFT
- #NTDOY
- #PEP
- #TSLA
- #TWTR
- AUDCAD
- AUDCHF
- AUDJPY
- AUDUSD
- EURCAD
- EURCHF
- EURGBP
- EURJPY
- EURNZD
- EURRUB
- EURUSD
- GBPAUD
- GBPCHF
- GBPJPY
- GBPUSD
- GOLD
- NZDCAD
- NZDCHF
- NZDJPY
- NZDUSD
- SILVER
- USDCAD
- USDCHF
- USDJPY
- USDRUB
- All
- M5
- M15
- M30
- H1
- D1
- All
- Buy
- Sale
- All
- 1
- 2
- 3
- 4
- 5
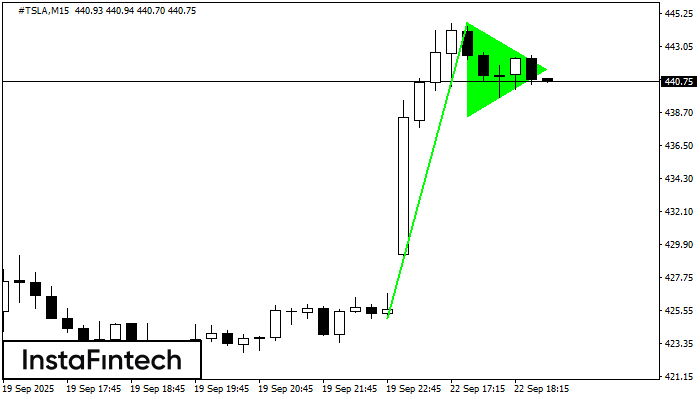
The Bullish pennant pattern is formed on the #TSLA M15 chart. It is a type of the continuation pattern. Supposedly, in case the price is fixed above the pennant’s high
The M5 and M15 time frames may have more false entry points.
Open chart in a new window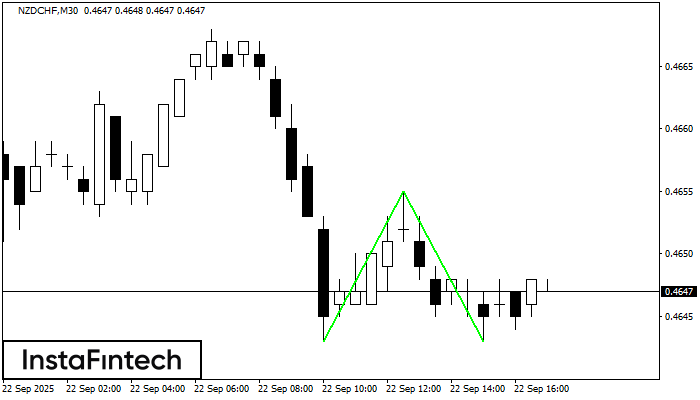
The Double Bottom pattern has been formed on NZDCHF M30; the upper boundary is 0.4655; the lower boundary is 0.4643. The width of the pattern is 12 points. In case
Open chart in a new window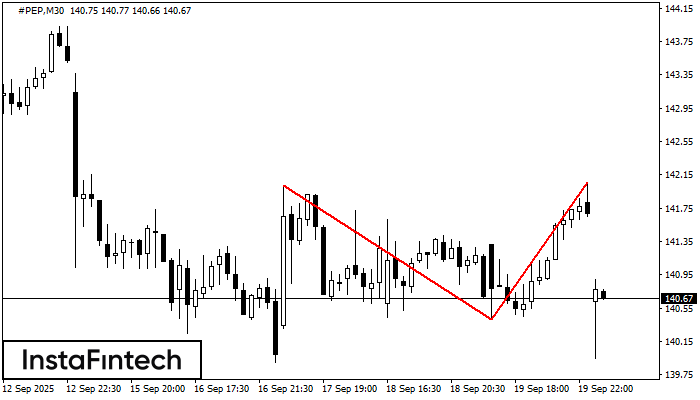
The Double Top reversal pattern has been formed on #PEP M30. Characteristics: the upper boundary 142.02; the lower boundary 140.41; the width of the pattern is 165 points. Sell trades
Open chart in a new window