signal strength 1 of 5
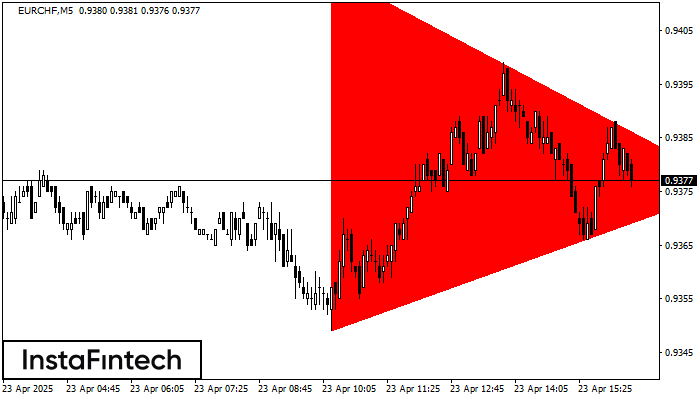
According to the chart of M5, EURCHF formed the Bearish Symmetrical Triangle pattern. Description: The lower border is 0.9349/0.9376 and upper border is 0.9416/0.9376. The pattern width is measured on the chart at -67 pips. The formation of the Bearish Symmetrical Triangle pattern evidently signals a continuation of the downward trend. In other words, if the scenario comes true and EURCHF breaches the lower border, the price could continue its move toward 0.9361.
The M5 and M15 time frames may have more false entry points.
See Also
- All
- Double Top
- Flag
- Head and Shoulders
- Pennant
- Rectangle
- Triangle
- Triple top
- All
- #AAPL
- #AMZN
- #Bitcoin
- #EBAY
- #FB
- #GOOG
- #INTC
- #KO
- #MA
- #MCD
- #MSFT
- #NTDOY
- #PEP
- #TSLA
- #TWTR
- AUDCAD
- AUDCHF
- AUDJPY
- AUDUSD
- EURCAD
- EURCHF
- EURGBP
- EURJPY
- EURNZD
- EURRUB
- EURUSD
- GBPAUD
- GBPCHF
- GBPJPY
- GBPUSD
- GOLD
- NZDCAD
- NZDCHF
- NZDJPY
- NZDUSD
- SILVER
- USDCAD
- USDCHF
- USDJPY
- USDRUB
- All
- M5
- M15
- M30
- H1
- D1
- All
- Buy
- Sale
- All
- 1
- 2
- 3
- 4
- 5
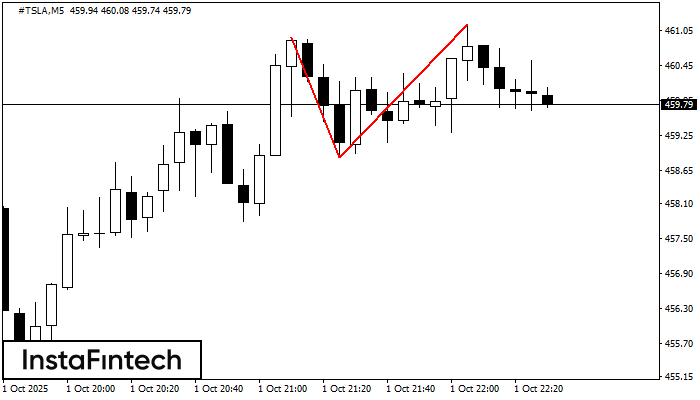
On the chart of #TSLA M5 the Double Top reversal pattern has been formed. Characteristics: the upper boundary 461.15; the lower boundary 458.88; the width of the pattern 227 points
The M5 and M15 time frames may have more false entry points.
Open chart in a new window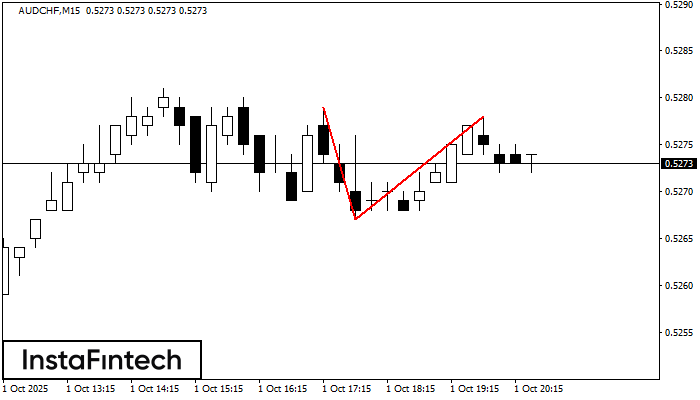
The Double Top pattern has been formed on AUDCHF M15. It signals that the trend has been changed from upwards to downwards. Probably, if the base of the pattern 0.5267
The M5 and M15 time frames may have more false entry points.
Open chart in a new window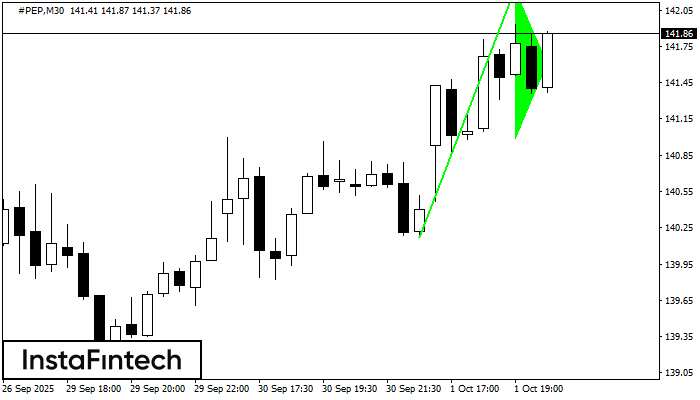
The Bullish pennant graphic pattern has formed on the #PEP M30 instrument. This pattern type falls under the category of continuation patterns. In this case, if the quote can breaks
Open chart in a new window