Actual patterns
Patterns are graphical models which are formed in the chart by the price. According to one of the technical analysis postulates, history (price movement) repeats itself. It means that the price movements are often similar in the same situations which makes it possible to predict the further development of the situation with a high probability.
Actual Patterns
- All
- Double Top
- Flag
- Head and Shoulders
- Pennant
- Rectangle
- Triangle
- Triple top
- All
- #AAPL
- #AMZN
- #Bitcoin
- #EBAY
- #FB
- #GOOG
- #INTC
- #KO
- #MA
- #MCD
- #MSFT
- #NTDOY
- #PEP
- #TSLA
- #TWTR
- AUDCAD
- AUDCHF
- AUDJPY
- AUDUSD
- EURCAD
- EURCHF
- EURGBP
- EURJPY
- EURNZD
- EURRUB
- EURUSD
- GBPAUD
- GBPCHF
- GBPJPY
- GBPUSD
- GOLD
- NZDCAD
- NZDCHF
- NZDJPY
- NZDUSD
- SILVER
- USDCAD
- USDCHF
- USDJPY
- USDRUB
- All
- M5
- M15
- M30
- H1
- D1
- All
- Buy
- Sale
- All
- 1
- 2
- 3
- 4
- 5
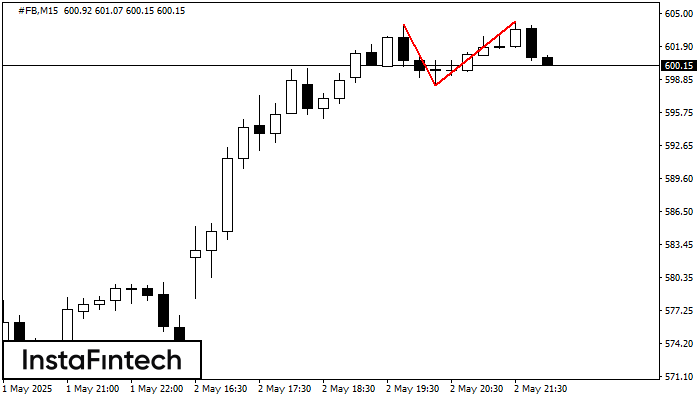
The Double Top pattern has been formed on #FB M15. It signals that the trend has been changed from upwards to downwards. Probably, if the base of the pattern 598.31
The M5 and M15 time frames may have more false entry points.
Open chart in a new window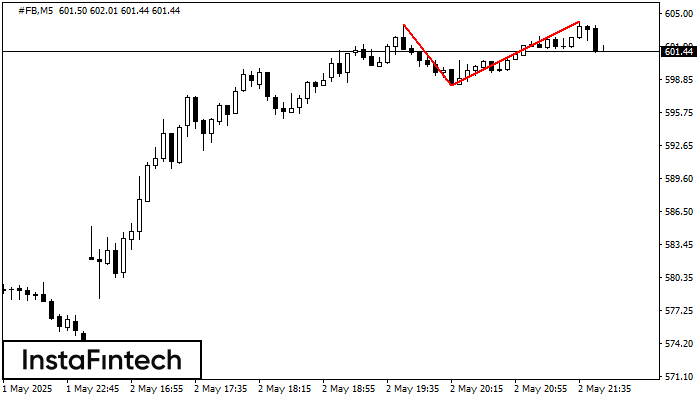
The Double Top reversal pattern has been formed on #FB M5. Characteristics: the upper boundary 604.00; the lower boundary 598.31; the width of the pattern is 594 points. Sell trades
The M5 and M15 time frames may have more false entry points.
Open chart in a new window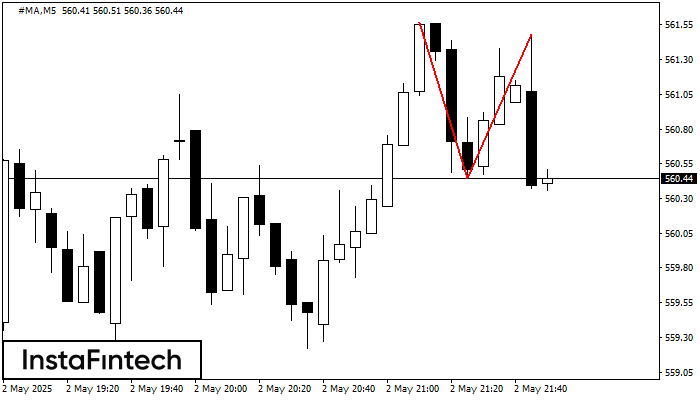
The Double Top reversal pattern has been formed on #MA M5. Characteristics: the upper boundary 561.57; the lower boundary 560.44; the width of the pattern is 104 points. Sell trades
The M5 and M15 time frames may have more false entry points.
Open chart in a new window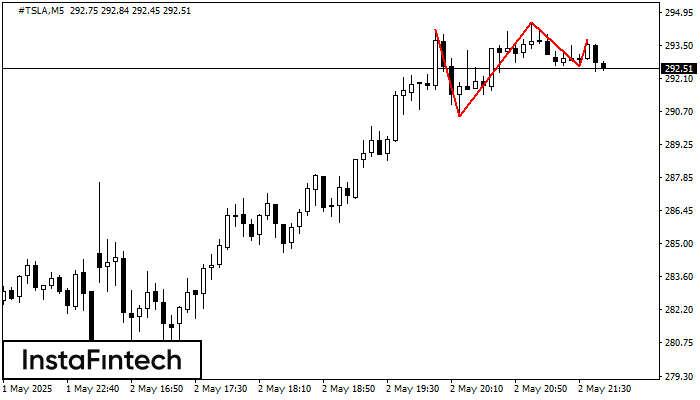
On the chart of the #TSLA M5 trading instrument, the Triple Top pattern that signals a trend change has formed. It is possible that after formation of the third peak
The M5 and M15 time frames may have more false entry points.
Open chart in a new window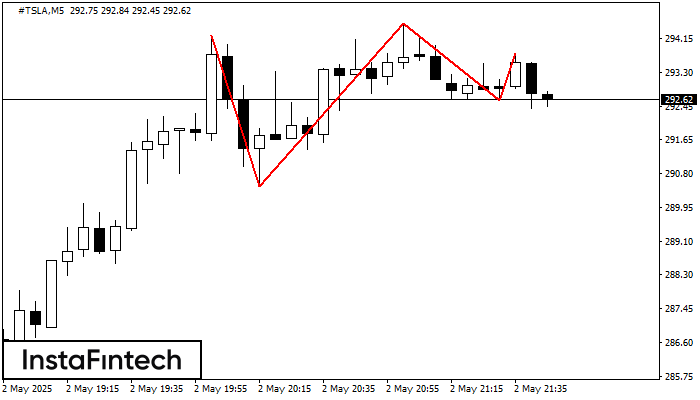
The Triple Top pattern has formed on the chart of the #TSLA M5. Features of the pattern: borders have an ascending angle; the lower line of the pattern
The M5 and M15 time frames may have more false entry points.
Open chart in a new window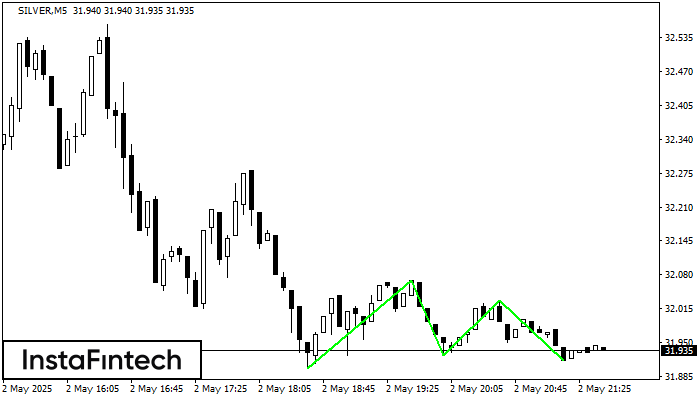
The Triple Bottom pattern has formed on the chart of the SILVER M5 trading instrument. The pattern signals a change in the trend from downwards to upwards in the case
The M5 and M15 time frames may have more false entry points.
Open chart in a new window
The Double Top reversal pattern has been formed on #NTDOY M15. Characteristics: the upper boundary 21.67; the lower boundary 21.54; the width of the pattern is 12 points. Sell trades
The M5 and M15 time frames may have more false entry points.
Open chart in a new window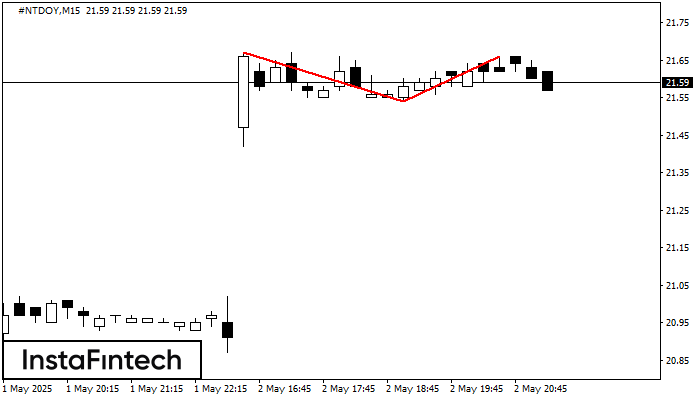
On the chart of #NTDOY M15 the Double Top reversal pattern has been formed. Characteristics: the upper boundary 21.66; the lower boundary 21.54; the width of the pattern 12 points
The M5 and M15 time frames may have more false entry points.
Open chart in a new window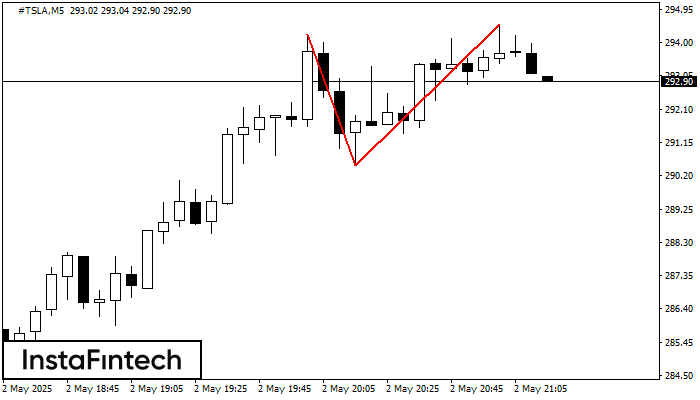
The Double Top reversal pattern has been formed on #TSLA M5. Characteristics: the upper boundary 294.22; the lower boundary 290.48; the width of the pattern is 404 points. Sell trades
The M5 and M15 time frames may have more false entry points.
Open chart in a new window