empty
27.03.2025 05:45 AM
#NDX – Technical Analysis Overview

This image is no longer relevant

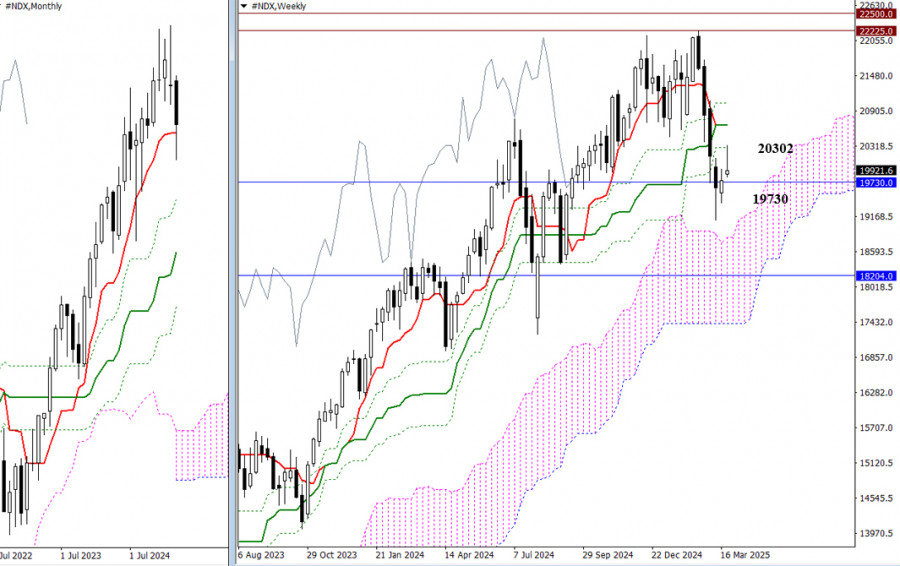
A stall at the monthly short-term trend level (19730) prompted an effort by bulls to reclaim their positions. As a result, a bullish gap formed at the start of the new trading week, with a test of the weekly resistance level at 20302. If this level is breached, the market will face two additional weekly resistance zones slightly above (20669 – 21036). However, if bulls lose momentum during a retest, the opposing side could swiftly return the market to the gravitational zone around the monthly Tenkan (19730), aiming to break the recent low (19113) and intensify bearish sentiment.

This image is no longer relevant

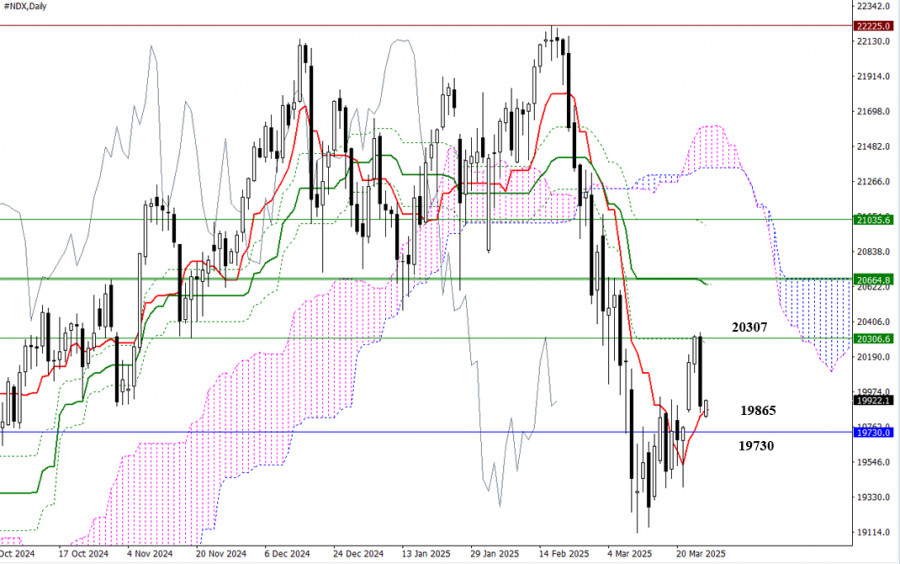
Yesterday's test of the Kijun Fibonacci levels (daily and weekly at 20302) resulted in a daily rebound. By the end of the session, the market had corrected downward to the daily short-term trend level (19865). The daily short-term trend supports (19865) and monthly supports (19730) will try to defend bullish interests. Failure to hold, breaking these supports, and moving out of the current attraction zone will shift market attention toward bearish targets—specifically, a new low at 19113 and a possible resumption of the broader downtrend.

This image is no longer relevant

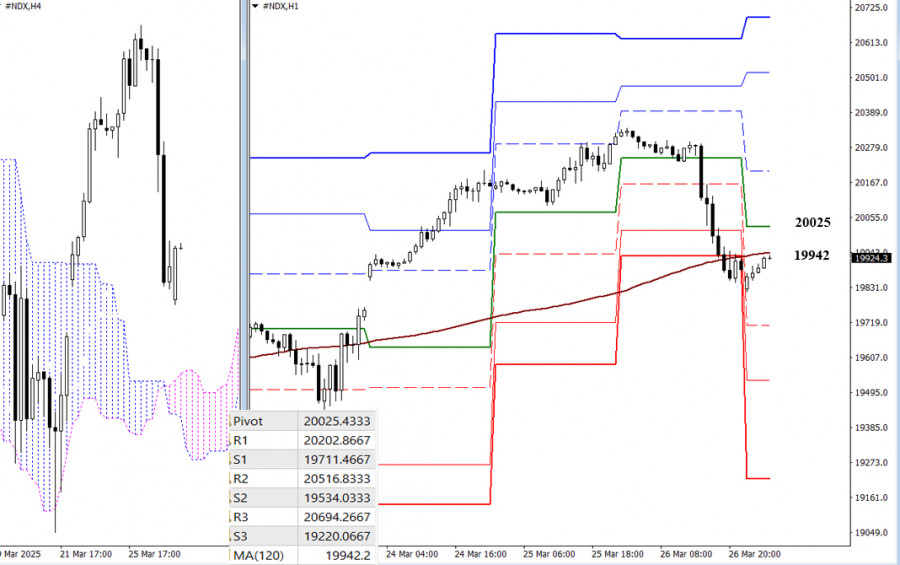
In the lower timeframes, the market now interacts with a key level determining the primary advantage: the weekly long-term trend in 19942. Whichever side holds this level will likely gain further momentum. Additional intraday bearish targets include the support levels of the classic Pivot Points (19712 – 19534 – 19220). Resistance levels at the classic Pivot Points (20025 – 20203 – 20517 – 20694) may serve as useful guides for bulls aiming to recover.

***

Technical Analysis Components:
  • Higher Timeframes: Ichimoku Kinko Hyo (9.26.52) and Fibonacci Kijun levels
  • H1: Classic Pivot Points and 120-period Moving Average (weekly long-term trend)
Evangelos Poulakis,
Analytical expert of InstaForex
© 2007-2025
Summary
Urgency
Analytic
Zhizhko Nadezhda
Start trade
Earn on cryptocurrency rate changes with InstaForex
Download MetaTrader 4 and open your first trade
  • Grand Choice
    Contest by
    InstaForex
    InstaForex always strives to help you
    fulfill your biggest dreams.
    JOIN CONTEST

Recommended Stories

Platinum has the potential to strengthen up to its nearest resistance level today. Tuesday, October 07, 2025.

[Platinum] – [Tuesday, October 07, 2025] With the RSI in the Neutral-Bearish area but both EMAs in a Golden Cross condition, Platinum should strengthen up to its nearest resistance

Arief Makmur 06:41 2025-10-07 UTC+2

Crude Oil seems likely to test its nearest support level today. Tuesday, October 07, 2025.

[Crude Oil] – [Tuesday, October 07, 2025] With the Death Cross condition of the EMA(50) and EMA(200), along with the RSI in the Neutral-Bearish zone, there is an opportunity

Arief Makmur 06:41 2025-10-07 UTC+2

EUR/USD Forecast for October 7, 2025

On Monday, the euro failed to close the opening gap. The price did not consolidate below the daily MACD line, and a long lower shadow formed—a sign that the market

Laurie Bailey 05:24 2025-10-07 UTC+2

GBP/USD Forecast for October 7, 2025

On Monday, the British pound attempted to slip further below the daily MACD line, but by the end of the day, a white candlestick had formed, rising 19 pips

Laurie Bailey 05:24 2025-10-07 UTC+2

EUR/CAD Forecast for October 7, 2025

On the weekly chart, the price has reversed from the upper boundary of the price channel. Multiple divergences have formed between the price and the Marlin oscillator. The Marlin signal

Laurie Bailey 05:24 2025-10-07 UTC+2

Forex forecast 06/10/2025: EUR/USD, GBP/USD, USD/JPY, USDX, Gold and Bitcoin

Useful links: My other articles are available in this section InstaForex course for beginners Popular Analytics Open trading account Important: The begginers in forex trading need to be very careful

Sebastian Seliga 21:36 2025-10-06 UTC+2

GBP/USD. Technical Analysis for the Week of October 6–11

Last week, the pair, moving upward, almost tested the retracement level of 14.6% – 1.3540 (red dotted line), and then the price went down, closing the weekly candle at 1.3478

Stefan Doll 12:05 2025-10-06 UTC+2

EUR/USD. Technical Analysis for the Week of October 6–11

Last week, the pair, moving upward, tested the resistance line at 1.1778 (bold blue line), and then the price went down, closing the weekly candle at 1.1741. In the upcoming

Stefan Doll 12:01 2025-10-06 UTC+2

EUR/USD Forecast on October 6, 2025

On Friday, the EUR/USD pair continued to rise after bouncing from the 76.4% retracement level at 1.1695. Thus, on Monday this process may continue toward the resistance zone of 1.1789–1.1802

Samir Klishi 11:56 2025-10-06 UTC+2

GBP/USD Forecast on October 6, 2025

On the hourly chart, the GBP/USD pair on Friday rose to the 61.8% retracement level at 1.3482, bounced off it, turned in favor of the dollar, fell to the 76.4%

Samir Klishi 11:42 2025-10-06 UTC+2
Can't speak right now?
Ask your question in the chat.
Widget callback
 

Dear visitor,

Your IP address shows that you are currently located in the USA. If you are a resident of the United States, you are prohibited from using the services of InstaFintech Group including online trading, online transfers, deposit/withdrawal of funds, etc.

If you think you are seeing this message by mistake and your location is not the US, kindly proceed to the website. Otherwise, you must leave the website in order to comply with government restrictions.

Why does your IP address show your location as the USA?

  • - you are using a VPN provided by a hosting company based in the United States;
  • - your IP does not have proper WHOIS records;
  • - an error occurred in the WHOIS geolocation database.

Please confirm whether you are a US resident or not by clicking the relevant button below. If you choose the wrong option, being a US resident, you will not be able to open an account with InstaForex anyway.

We are sorry for any inconvenience caused by this message.