signal strength 1 of 5
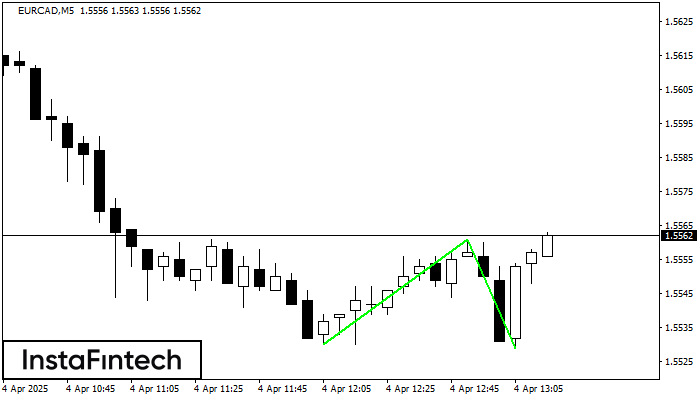
The Double Bottom pattern has been formed on EURCAD M5. Characteristics: the support level 1.5530; the resistance level 1.5561; the width of the pattern 31 points. If the resistance level is broken, a change in the trend can be predicted with the first target point lying at the distance of 32 points.
The M5 and M15 time frames may have more false entry points.
- All
- Double Top
- Flag
- Head and Shoulders
- Pennant
- Rectangle
- Triangle
- Triple top
- All
- #AAPL
- #AMZN
- #Bitcoin
- #EBAY
- #FB
- #GOOG
- #INTC
- #KO
- #MA
- #MCD
- #MSFT
- #NTDOY
- #PEP
- #TSLA
- #TWTR
- AUDCAD
- AUDCHF
- AUDJPY
- AUDUSD
- EURCAD
- EURCHF
- EURGBP
- EURJPY
- EURNZD
- EURRUB
- EURUSD
- GBPAUD
- GBPCHF
- GBPJPY
- GBPUSD
- GOLD
- NZDCAD
- NZDCHF
- NZDJPY
- NZDUSD
- SILVER
- USDCAD
- USDCHF
- USDJPY
- USDRUB
- All
- M5
- M15
- M30
- H1
- D1
- All
- Buy
- Sale
- All
- 1
- 2
- 3
- 4
- 5
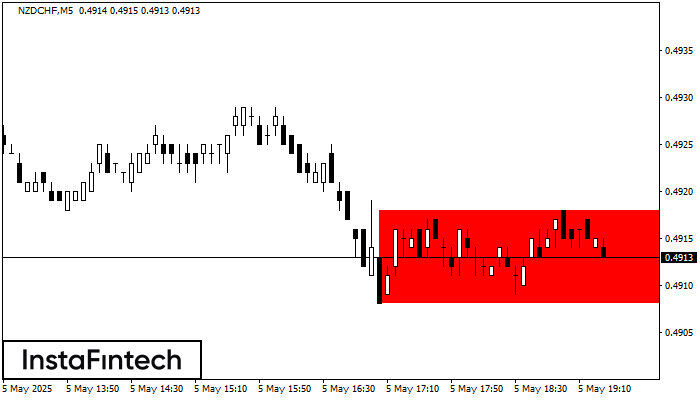
According to the chart of M5, NZDCHF formed the Bearish Rectangle. This type of a pattern indicates a trend continuation. It consists of two levels: resistance 0.4918 - 0.0000
The M5 and M15 time frames may have more false entry points.
Open chart in a new window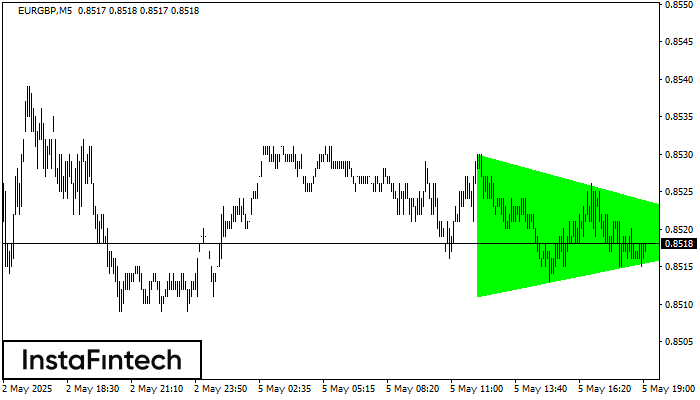
According to the chart of M5, EURGBP formed the Bullish Symmetrical Triangle pattern. The lower border of the pattern touches the coordinates 0.8511/0.8519 whereas the upper border goes across 0.8530/0.8519
The M5 and M15 time frames may have more false entry points.
Open chart in a new window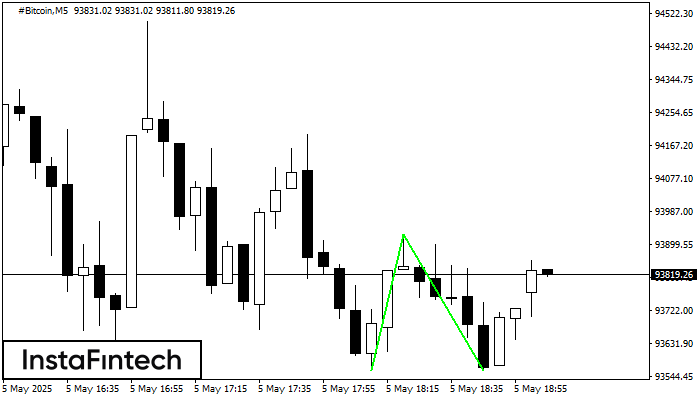
The Double Bottom pattern has been formed on #Bitcoin M5; the upper boundary is 93926.12; the lower boundary is 93560.62. The width of the pattern is 36607 points. In case
The M5 and M15 time frames may have more false entry points.
Open chart in a new window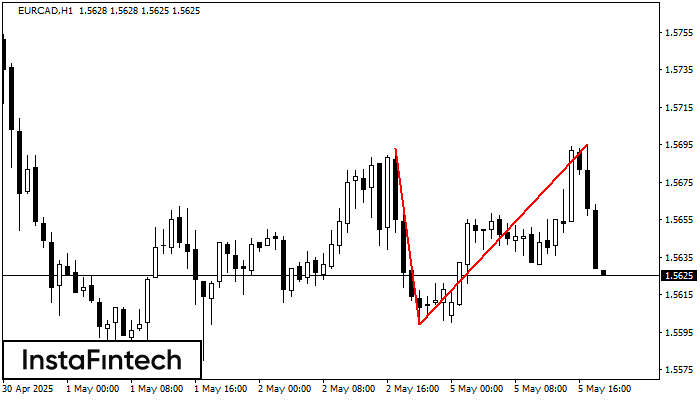
The Double Top reversal pattern has been formed on EURCAD H1. Characteristics: the upper boundary 1.5693; the lower boundary 1.5599; the width of the pattern is 96 points. Sell trades
Open chart in a new window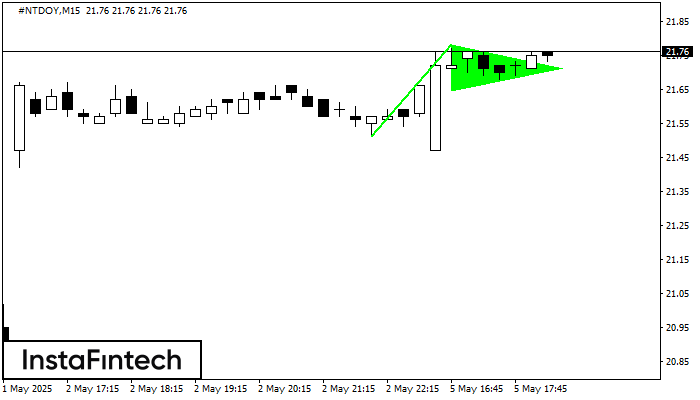
The Bullish pennant signal – Trading instrument #NTDOY M15, continuation pattern. Forecast: it is possible to set up a buy position above the pattern’s high of 21.78, with the prospect
The M5 and M15 time frames may have more false entry points.
Open chart in a new window
The Bullish pennant graphic pattern has formed on the #NTDOY M15 instrument. This pattern type falls under the category of continuation patterns. In this case, if the quote can breaks
The M5 and M15 time frames may have more false entry points.
Open chart in a new window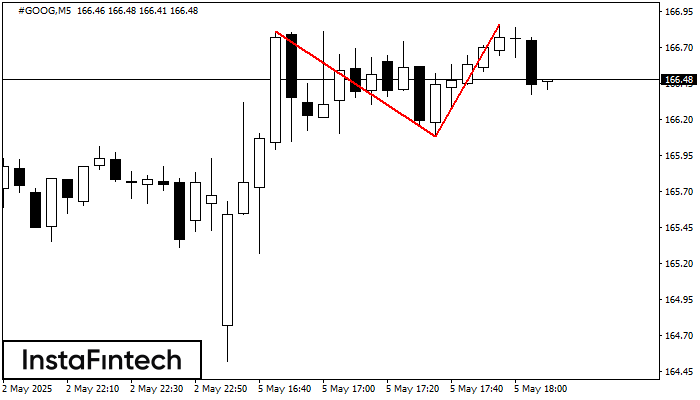
The Double Top reversal pattern has been formed on #GOOG M5. Characteristics: the upper boundary 166.81; the lower boundary 166.08; the width of the pattern is 78 points. Sell trades
The M5 and M15 time frames may have more false entry points.
Open chart in a new window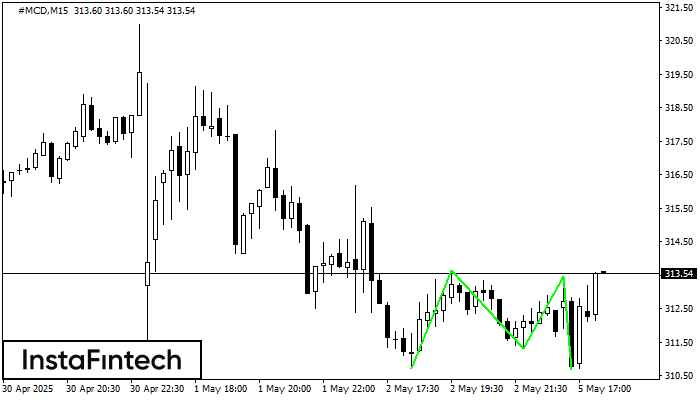
The Triple Bottom pattern has formed on the chart of the #MCD M15 trading instrument. The pattern signals a change in the trend from downwards to upwards in the case
The M5 and M15 time frames may have more false entry points.
Open chart in a new window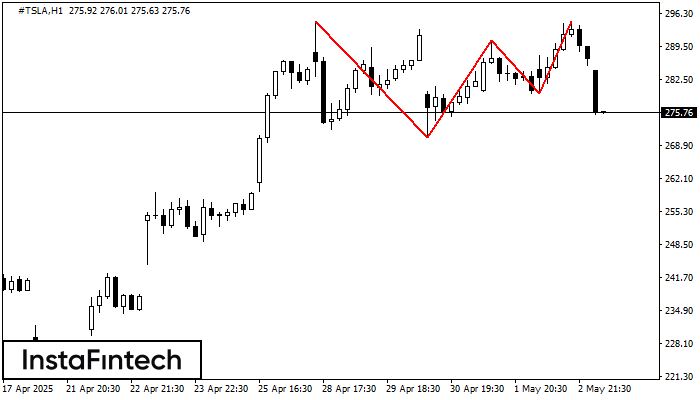
The Triple Top pattern has formed on the chart of the #TSLA H1. Features of the pattern: borders have an ascending angle; the lower line of the pattern
Open chart in a new window