signal strength 1 of 5
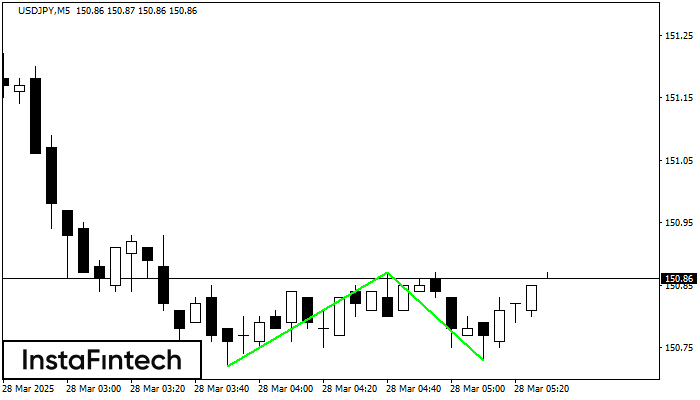
The Double Bottom pattern has been formed on USDJPY M5. Characteristics: the support level 150.72; the resistance level 150.87; the width of the pattern 15 points. If the resistance level is broken, a change in the trend can be predicted with the first target point lying at the distance of 14 points.
The M5 and M15 time frames may have more false entry points.
- All
- Double Top
- Flag
- Head and Shoulders
- Pennant
- Rectangle
- Triangle
- Triple top
- All
- #AAPL
- #AMZN
- #Bitcoin
- #EBAY
- #FB
- #GOOG
- #INTC
- #KO
- #MA
- #MCD
- #MSFT
- #NTDOY
- #PEP
- #TSLA
- #TWTR
- AUDCAD
- AUDCHF
- AUDJPY
- AUDUSD
- EURCAD
- EURCHF
- EURGBP
- EURJPY
- EURNZD
- EURRUB
- EURUSD
- GBPAUD
- GBPCHF
- GBPJPY
- GBPUSD
- GOLD
- NZDCAD
- NZDCHF
- NZDJPY
- NZDUSD
- SILVER
- USDCAD
- USDCHF
- USDJPY
- USDRUB
- All
- M5
- M15
- M30
- H1
- D1
- All
- Buy
- Sale
- All
- 1
- 2
- 3
- 4
- 5
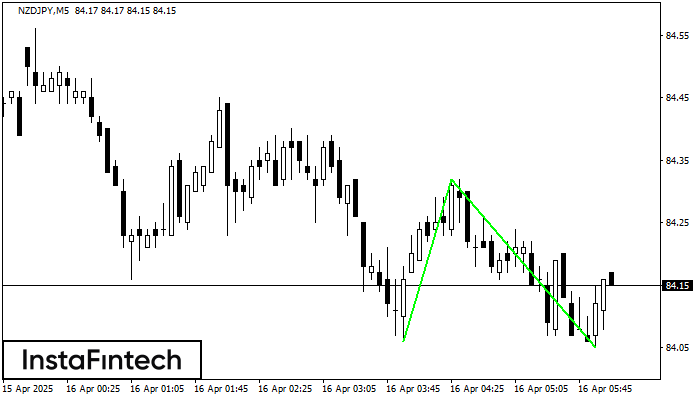
The Double Bottom pattern has been formed on NZDJPY M5. This formation signals a reversal of the trend from downwards to upwards. The signal is that a buy trade should
The M5 and M15 time frames may have more false entry points.
Open chart in a new window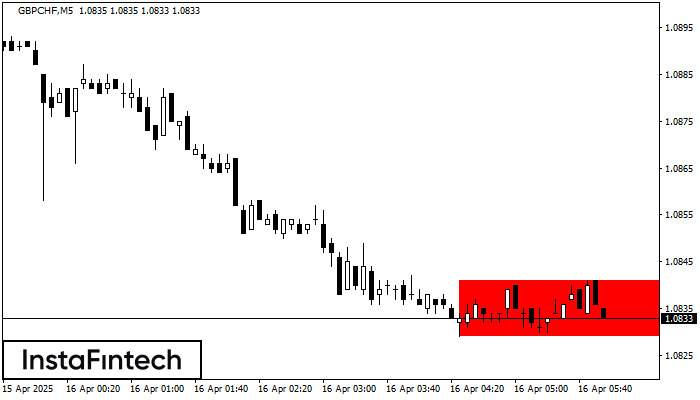
According to the chart of M5, GBPCHF formed the Bearish Rectangle. The pattern indicates a trend continuation. The upper border is 1.0841, the lower border is 1.0829. The signal means
The M5 and M15 time frames may have more false entry points.
Open chart in a new window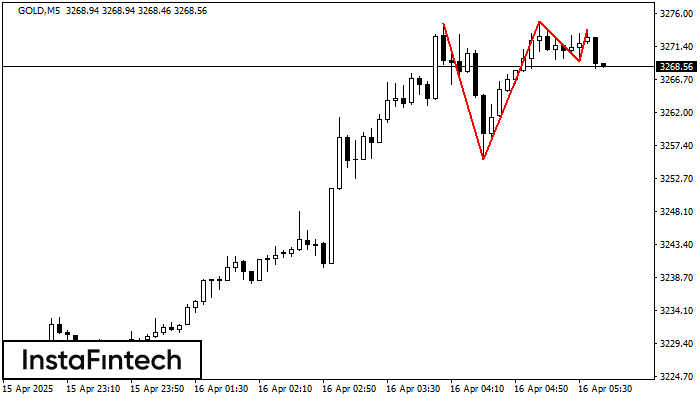
The Triple Top pattern has formed on the chart of the GOLD M5 trading instrument. It is a reversal pattern featuring the following characteristics: resistance level 87, support level -1386
The M5 and M15 time frames may have more false entry points.
Open chart in a new window