signal strength 1 of 5

According to the chart of M5, #Bitcoin formed the Bearish Rectangle. The pattern indicates a trend continuation. The upper border is 94251.10, the lower border is 94078.08. The signal means that a short position should be opened after fixing a price below the lower border 94078.08 of the Bearish Rectangle.
The M5 and M15 time frames may have more false entry points.
انظر أيضا
- All
- Double Top
- Flag
- Head and Shoulders
- Pennant
- Rectangle
- Triangle
- Triple top
- All
- #AAPL
- #AMZN
- #Bitcoin
- #EBAY
- #FB
- #GOOG
- #INTC
- #KO
- #MA
- #MCD
- #MSFT
- #NTDOY
- #PEP
- #TSLA
- #TWTR
- AUDCAD
- AUDCHF
- AUDJPY
- AUDUSD
- EURCAD
- EURCHF
- EURGBP
- EURJPY
- EURNZD
- EURRUB
- EURUSD
- GBPAUD
- GBPCHF
- GBPJPY
- GBPUSD
- GOLD
- NZDCAD
- NZDCHF
- NZDJPY
- NZDUSD
- SILVER
- USDCAD
- USDCHF
- USDJPY
- USDRUB
- All
- M5
- M15
- M30
- H1
- D1
- All
- Buy
- Sale
- All
- 1
- 2
- 3
- 4
- 5
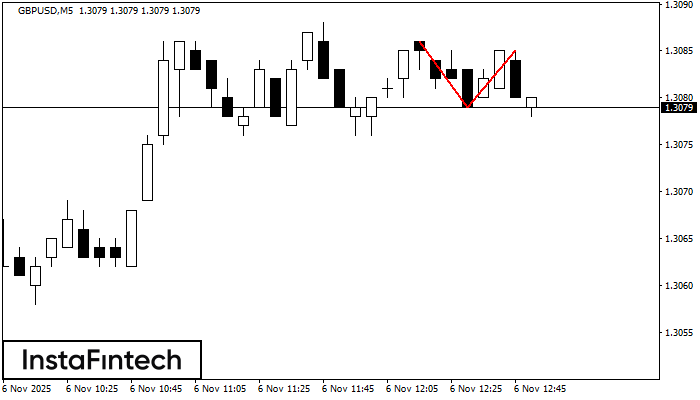
The Double Top pattern has been formed on GBPUSD M5. It signals that the trend has been changed from upwards to downwards. Probably, if the base of the pattern 1.3079
The M5 and M15 time frames may have more false entry points.
Open chart in a new window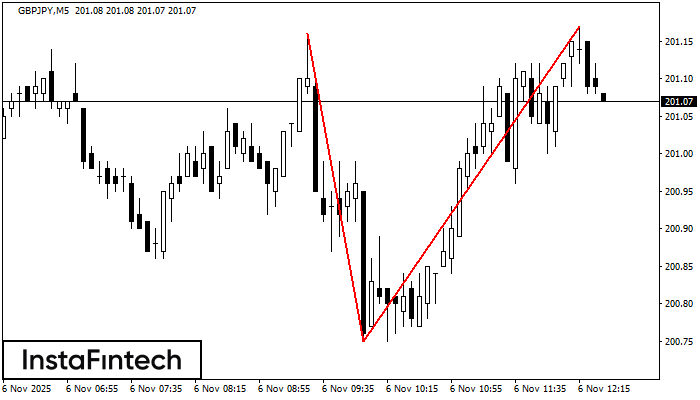
On the chart of GBPJPY M5 the Double Top reversal pattern has been formed. Characteristics: the upper boundary 201.17; the lower boundary 200.75; the width of the pattern 42 points
The M5 and M15 time frames may have more false entry points.
Open chart in a new window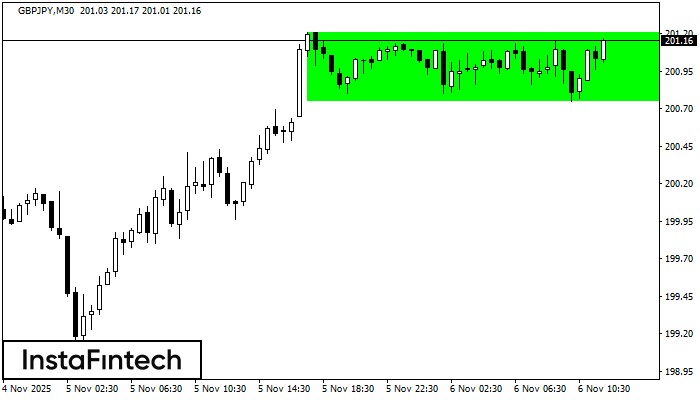
According to the chart of M30, GBPJPY formed the Bullish Rectangle. The pattern indicates a trend continuation. The upper border is 201.21, the lower border is 200.75. The signal means
Open chart in a new window