signal strength 2 of 5

The Double Bottom pattern has been formed on USDJPY M15; the upper boundary is 142.30; the lower boundary is 142.14. The width of the pattern is 17 points. In case of a break of the upper boundary 142.30, a change in the trend can be predicted where the width of the pattern will coincide with the distance to a possible take profit level.
The M5 and M15 time frames may have more false entry points.
انظر أيضا
- All
- Double Top
- Flag
- Head and Shoulders
- Pennant
- Rectangle
- Triangle
- Triple top
- All
- #AAPL
- #AMZN
- #Bitcoin
- #EBAY
- #FB
- #GOOG
- #INTC
- #KO
- #MA
- #MCD
- #MSFT
- #NTDOY
- #PEP
- #TSLA
- #TWTR
- AUDCAD
- AUDCHF
- AUDJPY
- AUDUSD
- EURCAD
- EURCHF
- EURGBP
- EURJPY
- EURNZD
- EURRUB
- EURUSD
- GBPAUD
- GBPCHF
- GBPJPY
- GBPUSD
- GOLD
- NZDCAD
- NZDCHF
- NZDJPY
- NZDUSD
- SILVER
- USDCAD
- USDCHF
- USDJPY
- USDRUB
- All
- M5
- M15
- M30
- H1
- D1
- All
- Buy
- Sale
- All
- 1
- 2
- 3
- 4
- 5
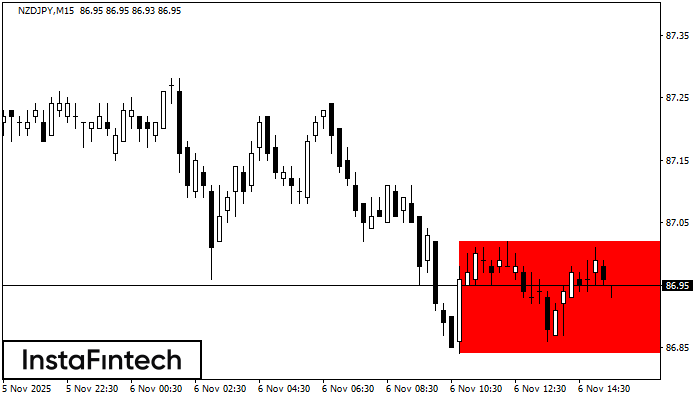
According to the chart of M15, NZDJPY formed the Bearish Rectangle. This type of a pattern indicates a trend continuation. It consists of two levels: resistance 87.02 - 0.00
The M5 and M15 time frames may have more false entry points.
Open chart in a new window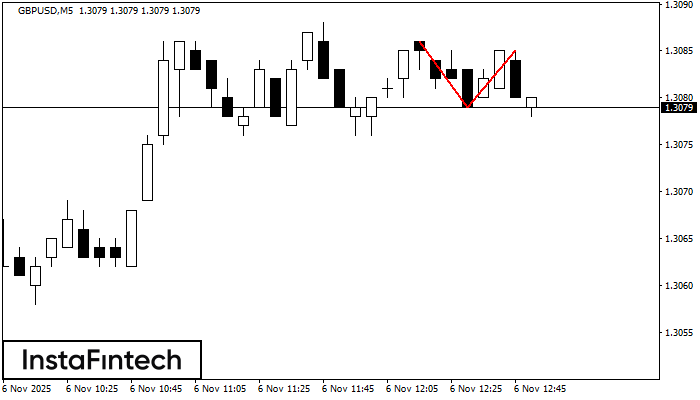
The Double Top pattern has been formed on GBPUSD M5. It signals that the trend has been changed from upwards to downwards. Probably, if the base of the pattern 1.3079
The M5 and M15 time frames may have more false entry points.
Open chart in a new window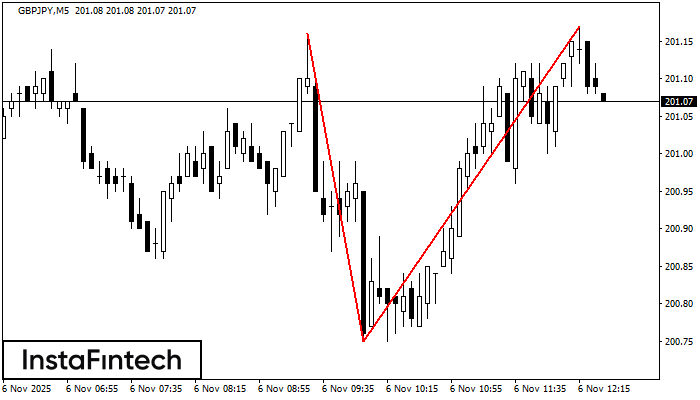
On the chart of GBPJPY M5 the Double Top reversal pattern has been formed. Characteristics: the upper boundary 201.17; the lower boundary 200.75; the width of the pattern 42 points
The M5 and M15 time frames may have more false entry points.
Open chart in a new window